

Originally published April 22, 2026, as a BioBoyScout white paper. Republished here on Substack with full content, embedded charts, and downloadable PDF. — Robert
A Deep-Dive Valuation Analysis of ARO-MAPT's Path to Acquisition Across Four Methodologies, Three Phase 1 Scenarios, and a $55 to $150 Billion Range of Outcomes
Robert Toczycki, JD, MBA
bioboyscout@gmail.com
847.227.7909
X: @BioBoyScout
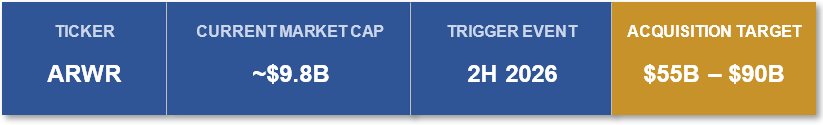
On November 18, 2025, the FDA approved Arrowhead Pharmaceuticals’ first commercial product, Redemplo (plozasiran). In the second half of 2026, Phase 1 data will read out from ARO-MAPT, Arrowhead’s subcutaneous tau-silencing program for Alzheimer’s disease. This readout is the single most consequential re-rating event for Arrowhead’s valuation: positive data validates subcutaneous CNS delivery and converts the company from pipeline biotech to strategic acquisition target. The stock trades at approximately $9.8 billion. This paper argues that number is materially mispriced. A Stage 1 acquisition range of $55 to $90 billion, roughly six to nine times today’s market cap, reflects what a disciplined competitive process produces, with Stage 2 forward optionality of $110 to $150 billion if positive Phase 2 cognitive data follows in 2029 to 2030.
Executive Summary
Arrowhead Pharmaceuticals (ARWR) trades at approximately $9.8 billion. In the second half of 2026, ARO-MAPT, Arrowhead’s subcutaneous tau-silencing program for Alzheimer’s disease, will produce Phase 1 human data.
The quality of that data will force one of three outcomes: probable acquisition in the $55 to $90 billion range (5.6× to 9.2× today’s market cap), meaningful re-rating with licensing as a realistic alternative path, or invalidation of the acquisition thesis bounded by a non-CNS floor at approximately today’s market cap. The asymmetric entry point is today, before the readout.
Key parameters
The three scenarios
Scenario probabilities are the paper’s assessment based on the prior evidence developed in Section I; reasonable alternative weightings produce qualitatively similar conclusions. If positive Phase 1 data does not result in a transaction within 12–18 months, positive Phase 2 cognitive endpoint data in 2029–2030 would open a subsequent valuation window at approximately $110–$150B. Stage 2 is treated as conditional forward optionality rather than a primary scenario.
Why now
The prior evidence base for positive Phase 1 data is substantial: BIIB080 has validated MAPT-silencing as a biomarker-active mechanism in humans; trontinemab has validated TfR1-mediated blood-brain-barrier transcytosis as a delivery route; Arrowhead’s non-human-primate CSF tau reduction data supports translational feasibility. Taken together, this prior evidence makes the weak Phase 1 scenario less probable than the current $9.8 billion valuation implies. Section VI develops the full probabilistic case.
Series context
This paper is the fourth in the BioBoyScout Arrowhead research series. The first, The Needle Wins (March 2026), established that the rapid adoption of GLP-1 auto-injectors has normalized subcutaneous injection as a chronic-disease delivery format, benefiting every commercial-scale RNAi therapeutics company. The second, Redemplo vs. Tryngolza (March 2026), analyzed the competitive dynamics between plozasiran and Ionis’s Tryngolza in the severe hypertriglyceridemia market following Ionis’s 2025 pricing action. The third, The Year of Tau (April 2026), examined the ARO-MAPT program in detail, the non-human-primate CSF tau reduction data, the TfR1-mediated blood-brain-barrier delivery mechanism, and the clinical development plan leading to the Phase 1 readout in 2H2026. Read together, the four papers trace the investment thesis from platform viability to commercial competitive dynamics to clinical catalyst to acquisition outcome.
What this paper establishes
The analysis that follows documents the asset inventory, the four valuation methodologies pharma M&A teams use to triangulate acquisition pricing, the Monte Carlo enterprise value distribution that anchors the Stage 1 range, and the specific acquirer and licensee rationales for Eli Lilly, Roche, Novartis. It commits to specific ranges for each scenario rather than deferring to qualitative conclusions.
Risk note: If ARO-MAPT Phase 1 data does not meet the moderate threshold, the acquisition thesis is invalidated. The downside is bounded by a non-CNS commercial business whose probability-adjusted value sits near today’s market cap. This is a meaningful but not catastrophic downside.
I. The Thesis
Arrowhead Pharmaceuticals trades at approximately $9.8 billion. The central argument of this paper is that this market capitalization underprices a specific and near-term opportunity: in the second half of 2026, Arrowhead’s lead CNS program, ARO-MAPT, will produce Phase 1 data that, depending on its quality, will force one of three distinct outcomes. One of those outcomes is probable acquisition at a valuation multiple of today’s market cap. Another is meaningful re-rating with extended optionality through licensing or delayed acquisition. The third is invalidation of the acquisition thesis, bounded by a non-CNS floor that limits downside. The purpose of this paper is to make the probabilistic case for each outcome.
The Phase 1 readout is the single most consequential event for Arrowhead’s valuation in the next three years.
ARO-MAPT is designed to silence MAPT, the gene that encodes tau protein, by delivering a subcutaneous RNAi therapeutic across the blood-brain barrier using Arrowhead’s TRiM delivery platform. Success means two things simultaneously: validation of tau-silencing as a disease-modifying approach to Alzheimer’s disease, and validation that Arrowhead has built the only subcutaneous CNS-delivery platform in the industry. The first makes ARO-MAPT commercially valuable, and the second makes Arrowhead strategically irreplaceable. No other siRNA company has demonstrated subcutaneous blood-brain-barrier crossing with therapeutic-scale gene silencing in humans. A positive Phase 1 readout converts Arrowhead from a pipeline company with an interesting platform into an acquisition target that strategic acquirers will find difficult to leave untouched.
The data will not be binary.
Phase 1 readouts produce continuous measurements on multiple dimensions: CSF tau reduction depth, durability of effect, blood-brain-barrier penetration efficiency, dose-response relationships, and tolerability signals. The market’s response, and the strategic response from potential acquirers, will be calibrated to the specific quality of the data, not to a simple yes/no outcome. This paper therefore organizes its analysis around three scenarios that capture the realistic distribution of Phase 1 outcomes, each with its own re-rate magnitude, acquisition probability profile, and alternative licensing path. The thresholds for each scenario are anchored to the published BIIB080 Phase 1b benchmark, the most directly comparable tau-silencing dataset in the clinical literature. The BIIB080 high-dose cohorts (60 mg monthly, 115 mg quarterly) achieved 51–56% CSF total tau reduction during the 3-month multiple ascending dose treatment period, with sustained approximately 60% reduction across all dose groups through the long-term extension. BIIB080 is delivered intrathecally; ARO-MAPT is delivered subcutaneously. A direct biomarker comparison therefore tests whether Arrowhead’s subcutaneous delivery platform achieves tau-silencing pharmacology comparable to or superior to the intrathecal benchmark.
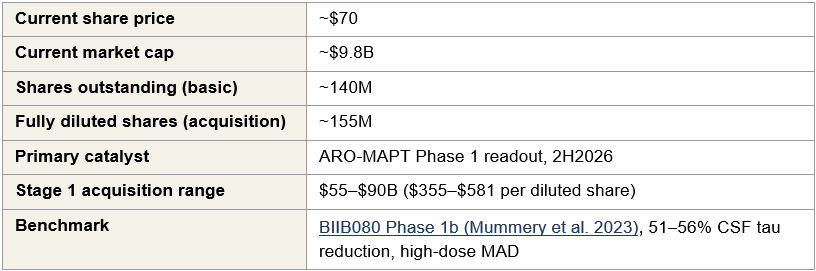
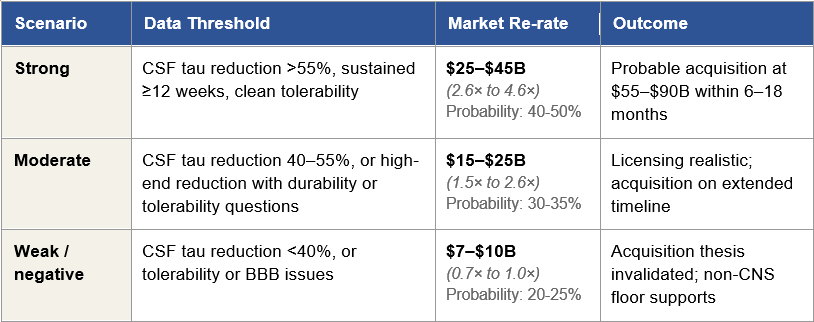
Figure 1: The Three Phase 1 Scenarios and Their Consequences
Figure 1: Three Phase 1 readout scenarios with corresponding re-rate ranges, acquisition outcomes, and alternative paths. Market cap multiples are anchored to Arrowhead’s approximately $9.8 billion current valuation. Per-share implications and detailed bidder dynamics are developed in later sections.
Two investment consequences follow.
First, the asymmetric entry point is today, before the Phase 1 data arrives. Under the strong data scenario, the re-rate alone produces a 2.6× to 4.6× return, and a subsequent acquisition at the Stage 1 range of $55 to $90 billion extends that to 5.6× to 9.2×. Under the moderate scenario, the re-rate produces a 1.5× to 2.6× return with extended upside optionality. Under the weak scenario, the downside is bounded by the non-CNS business at approximately 70–100% of today’s market cap. The expected value calculation across the distribution is favorable to entering a position today rather than waiting for the readout.
Second, the investor’s task today is not to predict which scenario will materialize, because Phase 1 data quality cannot be forecast with precision. The task is to assess the prior probability of each scenario given what is currently known: BIIB080’s validation of MAPT-silencing as a biomarker-active mechanism in humans, trontinemab’s validation of TfR1-mediated blood-brain-barrier transcytosis as a therapeutic-scale delivery route, Arrowhead’s non-human-primate CSF tau reduction data, and the ARO-MAPT Phase 1 dose escalation design. The weight of this prior evidence reduces the probability of the weak scenario below what the current market cap implies. Section VI quantifies this gap using Monte Carlo simulation across nine input variables; the probabilistic case is built there.
A note on terminology and the longer horizon.
Throughout this paper, “Stage 1” refers to the acquisition outcome that follows from the strong Phase 1 scenario: the $55 to $90 billion range developed in Section II and the sections that follow. “Stage 2” refers to the valuation window that opens if positive Phase 1 data does not produce a transaction within 12 to 18 months and Phase 2 cognitive endpoint data subsequently reads out positive in 2029–2030, which the paper estimates at approximately $110 to $150 billion. Stage 2 is treated as conditional forward optionality rather than a primary scenario; the analysis focuses on the Phase 1 readout and its immediate consequences because that is where the asymmetric investment opportunity lives.
If ARO-MAPT delivers, Arrowhead will either be acquired or will license ARO-MAPT at economics that produce a multi-fold return from today's market cap. If ARO-MAPT does not deliver, the downside is bounded by a real commercial business that exists independent of the platform thesis. The analysis in this paper commits to specific ranges for each path.
II. Price vs. Value
Arrowhead is worth somewhere between $55 billion and $90 billion in a competitive acquisition process if ARO-MAPT’s Phase 1 data meets the strong-case threshold developed in Section I. That range is roughly six to nine times today’s market cap. Both the market cap and the acquisition range are correct numbers. They answer different questions.
Today’s market cap is a price. A price is what the marginal public investor is willing to pay for the marginal share of common stock on any given trading day. It is the aggregate output of rNPV analysis applied by thirteen sell-side analysts, institutional positioning decisions made by portfolio managers who model disclosed programs against stage-dependent probability assumptions, and retail and algorithmic trading that moves on headlines and momentum without reference to the underlying asset’s strategic value. The price fluctuates with market sentiment, sector rotation, and news flow. It is real, and it is the liquidity-weighted consensus of what a diversified portfolio holder should pay for the right to own the share today.
The $55 to $90 billion range is a valuation. A valuation is what a strategic acquirer, evaluating the asset against their own infrastructure, their competitive landscape, and their long-term strategic plan, concludes the asset is worth plugged into their operations. It is the product of detailed synergy analysis, competitive positioning analysis, regulatory and commercial infrastructure analysis, and, critically, the cost-of-not-owning-it calculation that incorporates what happens if a competitor secures the platform first.
These two numbers diverge for Arrowhead specifically because the platform sits at a delivery inflection point and the public market cannot price platform inflections. Understanding why this is structurally true, not a temporary inefficiency that will correct through ordinary trading, is the foundation of the rest of this paper’s argument.
Why Big Pharma Does Not Use rNPV to Value Acquisitions
rNPV is the standard methodology taught in every pharmaceutical finance MBA program and applied by every sell-side analyst covering biotech. Estimate peak revenue for a drug program. Apply stage-dependent success probability. Discount back to present value. Sum across programs.
The methodology is internally consistent, defensible against audit, and appropriate for diversified pipeline companies where programs are largely independent. It is also structurally inadequate for platform companies at delivery inflection points, which is why no pharmaceutical M&A team applies rNPV as the primary valuation framework for acquisition decisions. M&A teams build their own rNPV as a standalone baseline, the number that anchors the floor of what a rational board would accept, and then apply strategic value adjustments, synergy quantification, competitive positioning analysis, and scenario modeling to arrive at the authorized bid range. The rNPV number is not the prediction of acquisition price, it is the floor beneath the acquisition price. The ceiling is set elsewhere.
The Eight Reasons Strategic Value Analysis Produces a Different Number
For Arrowhead specifically, eight structural factors drive the divergence between public market rNPV-derived pricing and strategic acquirer valuation. These are not rhetorical flourishes. Each one represents a specific valuation input that appears in an acquirer’s model and does not appear in a sell-side rNPV.
One: Platform optionality and correlated probability updates.
TRiM has validated delivery across six tissue types, five clinically (liver, lung, muscle, adipose, and CNS neurons via subcutaneous BBB crossing) and one preclinically (ocular). When ARO-MAPT validates subcutaneous TfR1-mediated BBB delivery, the probability of success for ARO-SNCA, ARO-HTT, ARO-ATXN3, and every future CNS program sharing that delivery mechanism rises simultaneously. rNPV treats each program as an independent probability tree. An acquirer treats these probability updates as correlated, which produces materially higher expected portfolio value.
Two: The engine generates candidates faster than rNPV can model them.
Arrowhead’s undisclosed pipeline includes a cardiometabolic program labeled Gene X, presented at the 7th Annual CNS Delivery Summit in December 2025 with approximately 90% mRNA knockdown in non-human-primate brains. That program is not in any sell-side model. An acquirer is not buying the disclosed pipeline; they are buying the engine that generates future pipelines. The engine has economic value independent of any specific current program.
Three: Acquirer-specific synergy.
Lilly’s commercial infrastructure reduces the cost of commercializing ARO-MAPT by approximately 20–25 points of margin. Roche’s trontinemab overlap reduces manufacturing and regulatory costs by 10–15 points. Novartis’s existing ARO-SNCA collaboration reduces technical integration costs by 5–10 points. These synergies are acquirer-specific, meaning they appear in an acquirer’s internal model and are entirely absent from any rNPV. The synergy premium is what allows different bidders to arrive at meaningfully different internal valuations for the same asset, the basis of competitive auction dynamics.
Four: Defensive value.
If Lilly does not acquire Arrowhead and Roche does, the competitive damage to Lilly’s Kisunla franchise has a present value of $15 to $30 billion over a decade. This is not a hypothetical cost. It is a real strategic liability that a rational acquirer factors into willingness to pay. rNPV cannot model competitive scenarios because rNPV is a single-entity cash-flow model. Defensive value is one of the largest single reasons acquirers bid above standalone rNPV.
Five: Combination therapy economics.
A two-mechanism AD franchise, IV amyloid clearance paired with subcutaneous quarterly tau silencing, has pricing power that neither asset achieves standalone. Combination regimens in oncology and immunology command 25–40% premiums over component pricing. For Lilly, the combination of Kisunla and ARO-MAPT is commercially additive in ways that neither drug can replicate individually. For Roche, trontinemab and ARO-MAPT combined produce the only two-mechanism AD franchise in existence where both drugs use TfR1-mediated BBB transcytosis as their delivery route. This scientific and commercial coherence is priced in the acquirer’s model and absent from sell-side rNPV.
Six: Diagnostic-therapeutic franchise coherence (Roche-advantaged).
Roche owns the Elecsys laboratory diagnostic platform, the dominant global infrastructure for Alzheimer’s blood-based biomarker testing. A Roche acquisition of Arrowhead creates a vertically integrated franchise: patient identification with Elecsys pTau-181 and pTau-217 assays, amyloid clearance with trontinemab, tau silencing with ARO-MAPT, and progression monitoring with the same biomarker platform. Note that Roche co-developed the Elecsys pTau blood tests with Lilly under a 2023 partnership, and Elecsys pTau-181 received FDA approval for primary care use in October 2025, so diagnostic access itself is not exclusive to a Roche bid. What remains uniquely Roche’s is ownership of the diagnostic infrastructure, per-test revenue capture across all AD testing volumes, and the ability to vertically integrate diagnostic-therapeutic economics without a partnership revenue-share. That vertical integration is strategic value that appears in Roche’s model and nowhere else.
Seven: Manufacturing and delivery moat.
TRiM requires proprietary chemistry, conjugation, and purification at scale. Arrowhead’s Verona facility provides three operational GMP lines with a 2028 option to acquire 6.24 adjacent acres for commercial-scale expansion. Replacement cost of building this infrastructure from scratch is approximately $2 to $4 billion and five to seven years of construction and qualification. An acquirer values this infrastructure as strategic currency, immediately usable capacity that contract manufacturers cannot replicate. The 6.24-acre adjacent parcel under option through 2028 is an additional layer of strategic value that deserves specific attention. Exercising the option and building expansion capacity on the adjacent parcel would cost an acquirer an estimated 40–60% less than constructing a comparable greenfield GMP facility at a new location, with a timeline compression of roughly 18–24 months. The cost advantage reflects reuse of existing site infrastructure (utilities, permits, environmental qualification, shared services) and partially reusable design work; the time advantage reflects the elimination of site selection, permitting, and initial regulatory qualification phases. For an acquirer planning to scale TRiM manufacturing across multiple commercial products over the next decade, this expansion pathway is not a theoretical asset, it is a pre-positioned capability with quantifiable economic value that a standalone Arrowhead would realize more slowly. rNPV does not assign value to manufacturing beyond the implicit assumption that production capacity exists.
Eight: Accelerated development through acquirer clinical infrastructure.
Lilly and Roche each operate thousands of active clinical trial sites globally, with dedicated CNS trial infrastructure and established protocols for AD-specific enrollment. Plugging ARO-MAPT into that network compresses Phase 2 and Phase 3 enrollment timelines by an estimated 12 to 24 months compared to Arrowhead running these trials standalone. For a Phase 3 AD trial running four to six years, that time compression has material present value; earlier approval, earlier revenue, earlier patent-life capture. This value appears in an acquirer’s model as a line item and is entirely absent from a sell-side rNPV that assumes standalone development timelines.
Why Competitive Bidding Makes Strategic Value Analysis the Only Relevant Framework
In a negotiated M&A transaction with two or more motivated bidders, the final price is controlled by the second-highest bidder’s maximum willingness to pay plus a minimum increment to win. This is not a theoretical proposition; it is the mechanical consequence of auction dynamics applied to corporate M&A. The auction mechanism produces price discovery by forcing each bidder to reveal, through the act of raising their bid, progressively more of their internal valuation.
For Arrowhead post-Phase 1, under the strong data scenario developed in Section I, three strategic bidders, Lilly, Roche, and Novartis, evaluate ARO-MAPT against their own strategic value frameworks. Their internal valuations differ, in absolute terms probably by $20 to $40 billion at Stage 1, because each bidder’s synergy stack, defensive liability, and platform integration value is different. But every one of those internal valuations reflects strategic value analysis with acquirer-specific synergy, defensive value, and positioning economics. None of them reflect sell-side rNPV.
The final price is therefore set by the interaction of these strategic valuations, not by the rNPV framework that generates the public-market stock price. The $9.8 billion market cap is an interesting datapoint, it tells an acquirer what they cannot bid below, because Arrowhead’s board would have fiduciary grounds to reject any bid at a trivial premium over market cap. The market cap does not set the ceiling. The ceiling is set by the most motivated bidder’s strategic value number, constrained downward only by the need to exceed the second-highest bidder’s maximum.
The gap between price ($9.8 billion) and strategic value ($55 to $90 billion at Stage 1) is not a market inefficiency that will close through ordinary trading. It is a framework inefficiency that will close only when a framework-appropriate event, positive Phase 1 data, forces the market to shift from rNPV pricing to strategic value pricing. That shift is the re-rate modeled in Section I’s three scenarios.
What an Acquirer Pays For
A strategic acquirer of Arrowhead at Stage 1 is paying for five distinct categories of value. Understanding these categories helps calibrate why the total exceeds any individual asset’s rNPV.
Assets in the current disclosed pipeline.
Plozasiran franchise across FCS (approved), sHTG (near approval), and the CAPITAN CVOT optionality; ARO-MAPT across AD and the orphan tauopathies (PSP, CBD, FTD-MAPT); obesity pipeline; pulmonary programs including ARO-RAGE; complement programs (ARO-C3, ARO-CFB); Sarepta and Novartis partnership streams. These are the programs a sell-side analyst would find in a model, probability-weighted against published trial timelines.
Platform capacity to generate future programs.
Gene X. Ocular TRiM. Cardiomyocyte TRiM. Programs that exist in Arrowhead’s internal roadmap but are not in sell-side models because they have not been disclosed in sufficient detail to model. An acquirer pays for the engine, not just the current output. The engine has produced ARO-MAPT, ARO-RAGE, ARO-SNCA, Gene X, and numerous other candidates; there is no analytical reason to assume it will stop producing.
Strategic positioning.
The cost of not owning the platform if a competitor owns it instead. For Lilly, this is the Kisunla defensive premium, the value of preventing a subcutaneous tau silencer from pressuring the IV amyloid franchise for a decade. For Roche, this is the trontinemab scientific coherence, the value of being the only company to operate both approved TfR1-delivered drugs. For Novartis, this is the ARO-SNCA collaboration integration, the value of controlling the full platform after already paying for partial access.
Infrastructure.
Verona GMP manufacturing with expansion option; clinical operations including the ARO-MAPT Phase 1 protocol execution; TRiM chemistry expertise accumulated over fifteen years of platform development; regulatory team experience across nine IND filings in multiple therapeutic areas. Replacement cost of building this from scratch is $2 to $4 billion and five to seven years of construction, hiring, and qualification. An acquirer integrates this infrastructure on day one.
Optionality on competitive landscape.
The platform becomes more valuable as competitive alternatives emerge (defensive value rises as competitors threaten Kisunla or other approved AD therapies) and as the platform generates additional validated tissue types (offensive value rises as more therapeutic indications become accessible). A Stage 1 acquirer is buying optionality on both directions of this evolution, a call option on defensive value and a call option on offensive platform expansion.
Comparable Pharmaceutical Acquisitions
History anchors the math. The question is not whether strategic pharmaceutical acquisitions at multi-billion-dollar premiums over market cap occur, they occur regularly, but at what multiples, for what types of assets, and with what structural characteristics. Figure 2 summarizes four recent comparable transactions, each one a catalyst-driven acquisition involving a clinical-stage or early-commercial biotech with a validated mechanism.
Figure 2: Comparable Pharmaceutical Acquisitions
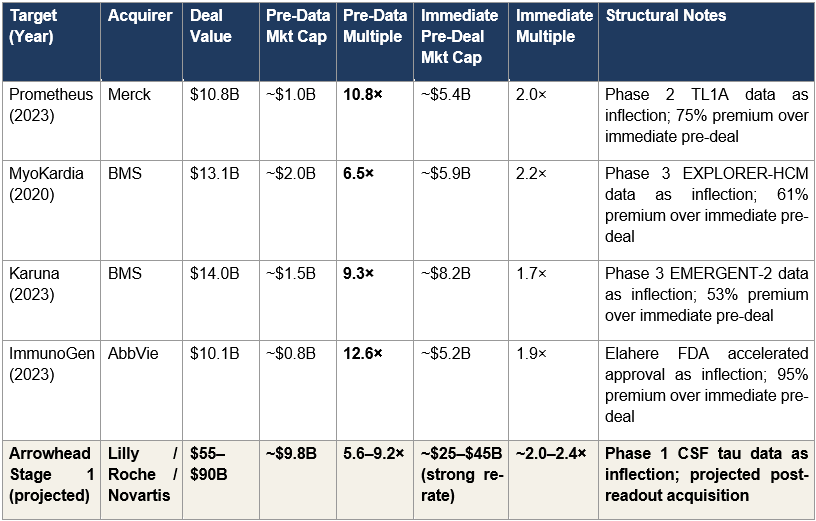
Figure 2: Four historical pharmaceutical acquisitions with both pre-data and immediate pre-deal multiples. Arrowhead’s projected Stage 1 multiples sit within the historical range on both dimensions: the 5.6–9.2× pre-data multiple is consistent with Prometheus (10.8×), MyoKardia (6.5×), Karuna (9.3×), and ImmunoGen (12.6×); the approximately 2.0–2.4× immediate pre-deal multiple is consistent with the typical acquisition-premium-over-re-rated-market-cap range across all four comparables.
The Prometheus transaction is the most instructive single comparable. Prometheus traded at roughly $1 billion market cap at $36 per share before reporting positive Phase 2 TL1A data in ulcerative colitis (ARTEMIS-UC) and Crohn’s disease (APOLLO-CD) in December 2022. The clinical results triggered a market re-rate to approximately $5.4 billion by April 2023. Merck then paid $10.8 billion (a 75% premium over the re-rated market cap) to acquire the company. The compound multiple from pre-data entry to acquisition close is 10.8×.
The structural parallel to Arrowhead-today is direct. An investor positioned in Prometheus before the Phase 2 data captured the full compound return (10.8×) through the combination of the re-rate and the subsequent acquisition premium. An investor who waited until the data was reported, re-rated the stock, and then bought at the re-rated level captured only the acquisition premium (2.0× from the re-rated market cap). The asymmetric entry point was before the data, not after. Arrowhead today sits in the analogous position: $9.8 billion market cap before Phase 1 data, with a three-scenario outcome distribution that makes today’s entry the asymmetric position.
MyoKardia, Karuna, and ImmunoGen each follow the same structural pattern at somewhat different magnitudes. MyoKardia traded at approximately $2 billion market cap before positive Phase 3 EXPLORER-HCM data; BMS subsequently paid $13.1 billion for a 6.5× pre-data multiple. Karuna traded at approximately $1.5 billion market cap before positive Phase 3 EMERGENT-2 schizophrenia data; BMS subsequently paid $14 billion for a 9.3× pre-data multiple. ImmunoGen traded at approximately $0.8 billion market cap before the November 2022 FDA accelerated approval of Elahere; AbbVie subsequently paid $10.1 billion for a 12.6× pre-data multiple. In each case, the catalyst was a single data or regulatory event that shifted the market’s framework from speculative clinical valuation to acquisition-premium valuation. Arrowhead’s Phase 1 CSF tau readout in 2H2026 is the same category of event.
Note on Alnylam.
Alnylam Pharmaceuticals, Arrowhead’s nearest RNAi competitor, trades at approximately $42 billion as of this writing. Alnylam is not a transaction comparable, it has not been acquired and no public acquisition process is underway, but it establishes what a diversified commercial-stage RNAi platform is worth in the public market today. Alnylam has approved products across multiple indications and validated delivery to liver, muscle, and CNS (via intrathecal administration). Arrowhead, with a more differentiated delivery platform that includes subcutaneous CNS crossing (which Alnylam has not replicated) and a broader clinical pipeline (nineteen programs across ten owned and nine partnered vs. Alnylam’s narrower focus), should not trade at a permanent discount to Alnylam. The current $9.8 billion Arrowhead market cap versus $42 billion Alnylam market cap reflects the delivery-platform validation gap that the Phase 1 readout will resolve. Resolving it in favor of Arrowhead’s subcutaneous CNS validation produces a public market re-rate that begins to close the Alnylam gap, independent of any acquisition process.
Why Large Platform Acquisitions Prove Value-Accretive
The most important historical precedent for understanding why a rational strategic acquirer might pay $55 to $90 billion for Arrowhead is not in the recent comparable-deal data set. It is in Roche’s 2009 acquisition of the remaining public stake in Genentech for approximately $46.8 billion.
At the time of the transaction, the Genentech deal was characterized as expensive, even aggressive. Analysts questioned whether Roche could justify the premium. Within a decade, the acquisition was recognized as one of the most value-accretive transactions in pharmaceutical industry history. The Genentech antibody platform became the foundation of Roche’s oncology franchise and produced multi-hundred-billion-dollar cumulative revenue across Herceptin, Rituxan, Avastin, Perjeta, Kadcyla, and subsequent programs. The apparent premium at acquisition was trivial compared to the value the platform generated under Roche ownership.
The structural argument for an Arrowhead acquisition is the same argument, applied to a different platform technology at a different inflection point. A strategic acquirer who pays $55 to $90 billion for Arrowhead at Stage 1 is not primarily paying for ARO-MAPT in Alzheimer’s disease, though that asset is the immediate value driver. They are paying for a delivery platform that has validated mechanisms across six tissue types and has demonstrated the capacity to generate clinical-stage candidates at a rate that exceeds the industry’s delivery-platform benchmarks. If that platform produces two or three additional approved drugs over the next decade, a reasonable base case given the current pipeline, the acquisition economics justify themselves independent of any single asset’s commercial outcome. The Genentech precedent is the correct analytical frame for understanding what acquirers actually pay for when they acquire platforms, and why the apparent premium at transaction is not the right lens for evaluating the transaction ex post.
Arrowhead’s $9.8 billion market cap reflects public-market rNPV pricing. A strategic acquirer evaluating ARO-MAPT after positive Phase 1 data applies strategic-value analysis, which incorporates synergy, defensive value, and platform optionality that rNPV structurally cannot capture. The gap between those two frameworks is the investment opportunity.
III. Analyst Coverage
Approximately a dozen sell-side analysts cover Arrowhead Pharmaceuticals with active 12-month price targets. The consensus target sits in the range of $76 to $82 per share, implying a target market cap of roughly $10.5 to $11.5 billion. The high-end target on the street is approximately $110 per share, implying a market cap of roughly $15 billion. The low-end target, from a small number of bearish firms, is approximately $35 per share, implying a market cap of roughly $5 billion.
Every one of these numbers is dramatically below the $55 to $90 billion Stage 1 acquisition range developed in this paper. Even the most bullish analyst on the street today is producing a price target that implies a market cap roughly 15% of the Stage 1 acquisition floor. This is not because the analysts believe Arrowhead is worth less than the market assigns; the consensus target represents a modest premium over the current price. It is because the institutional sell-side price target framework cannot accommodate the kind of conditional acquisition thesis this paper describes.
Sell-side price targets are built on three structural constraints that prevent strategic acquisition value from being incorporated.
Twelve-month time horizon.
A sell-side price target is a prediction of what the stock will trade at in approximately twelve months under normal-course-of-business operating assumptions. It is not a target price under an acquisition scenario. An analyst whose 12-month price target reflected an 8× return from current prices would be immediately accused of speculation; their compliance department would flag the note; their sales force would not distribute it. The framework is designed to produce small-magnitude price movements against current prices, which structurally excludes acquisition value by construction.
Probability-weighted scenarios around a base case.
Most sell-side models produce a base case (rNPV-derived), a bull case (somewhat higher peak revenue or earlier timelines), and a bear case (pipeline setbacks). The bull case rarely incorporates acquisition scenarios because acquisitions are idiosyncratic events that cannot be probability-weighted in a defensible way for a 12-month horizon. The analyst who writes “my bull case assumes a $70 billion acquisition from Lilly” is producing an unmodelable claim. The analyst who writes “my bull case assumes 15% higher peak sales and a 12-month earlier launch” is producing a standard, defensible sell-side bull case. The framework selects against the former and selects for the latter.
rNPV as the central valuation discipline.
Every covering analyst uses some variant of rNPV. As established in Section II, this methodology is appropriate for diversified pipeline companies but systematically inadequate for platform companies at delivery inflection points. rNPV applied to Arrowhead today produces the current spread of target prices across the $35 to $110 per share range. The analysts are not wrong within their framework, they are correctly applying an inappropriate framework.
The Implication
When Phase 1 data arrives in the second half of 2026 and the stock re-rates, sell-side coverage will update. Analysts will raise their price targets, probably substantially, given the magnitude of the prior evidence base this paper has laid out, but their updated price targets will still reflect rNPV-based frameworks, now with higher probability inputs for the ARO-MAPT program. The analyst consensus after a strong Phase 1 readout will converge toward a target range consistent with the strong-case market cap developed in Section I’s scenario framework. The sell-side consensus, in other words, will eventually arrive at the re-rated market cap this paper projects, but it will do so by tracking the market’s own pricing, not by anticipating it. Even after this re-rate, the analyst consensus will remain well below the acquisition range. The gap between rNPV-derived targets and strategic acquisition value is not a gap that closes; it is a framework boundary.
An individual investor who waits for sell-side price targets to capture the full acquisition thesis will be waiting indefinitely. The analysts’ framework converges on an rNPV-compliant representation of the re-rated market cap. It does not converge on the acquirer’s willingness to pay, because the analysts’ framework cannot produce that number without violating the institutional constraints that define sell-side coverage.
The One Path Toward a Conditional Analyst Note
There is, however, one path by which a sell-side analyst could begin to close this gap without violating any of the structural constraints described above. A conditional scenario note, framed as follows:
If ARO-MAPT delivers positive Phase 1 human data in 2H2026, we believe strategic acquisition interest from Lilly, Roche, or Novartis could realistically value ARWR in the range of $55 to $90 billion, representing a per-share price of approximately $355 to $581 on a fully diluted basis.
That sentence is compliance-defensible because it is conditional and range-bound. It is analytically honest because the math supports it. It is commercially significant because the first analyst who publishes it will produce the most-read piece of research on this stock in years. The remaining analysts will have to respond, either by engaging with the conditional framework or by explicitly rejecting it. In either case, the market begins pricing the acquisition optionality that it has, to this point, been ignoring.
When that repricing occurs, whether because an analyst publishes the conditional note or because Phase 1 data arrives and forces the reframing, the analytical work that preceded the institutional consensus will have served its purpose. Until then, the reader cannot outsource the acquisition-thesis analytical work to the sell side. The framework constraints that produce the current $76 to $82 average price target are the same framework constraints that will prevent the sell-side from naming the acquisition range until after it is no longer an asymmetric entry point.
The dozen analysts covering Arrowhead produce price targets clustered at $35 to $110 per share, 5 to 15 percent of the Stage 1 acquisition range developed in this paper. The analysts are not wrong within their framework; they are applying an rNPV framework that cannot incorporate acquisition value by construction.
IV. The Non-ARO-MAPT Portfolio
The three-scenario framework developed in Section I depends on understanding what Arrowhead is worth besides ARO-MAPT. In the strong scenario, the non-ARO-MAPT portfolio is what an acquirer gets beyond the Alzheimer’s program; it drives a significant portion of the $55 to $90 billion valuation range. In the weak scenario, the non-ARO-MAPT portfolio is what bounds the downside; it establishes the approximately 70 to 100 percent of today’s market cap floor that the Phase 1 failure case assumes.
This section catalogs those assets. It does not attempt to build comprehensive revenue forecasts or probability-weighted valuations for each program; Sections V and VI take up that work using formal valuation methodology. The purpose here is to establish what is in the portfolio, what stage each program has reached, and what makes each relevant to the acquisition thesis.
The Commercial Cardiometabolic Franchise
Arrowhead transitioned into a commercial-stage company on November 18, 2025, when the FDA approved REDEMPLO (plozasiran) for familial chylomicronemia syndrome (FCS). REDEMPLO is Arrowhead’s first approved medicine and the anchor of the cardiometabolic franchise. Arrowhead is launching the drug independently in the United States using the One-REDEMPLO pricing model, which establishes a consistent price across current and potential future indications, a deliberate strategic choice that simplifies payor negotiations as the drug expands into additional triglyceride-lowering indications. China’s NMPA approved REDEMPLO for FCS in April 2026, with Sanofi handling commercialization in Greater China under the agreement that Sanofi purchased from Visirna in 2025.
The FCS indication itself is a modest commercial opportunity. Roughly 6,500 people in the United States live with genetic or clinical FCS, characterized by triglyceride levels 10 to 100 times higher than normal and substantial risk of acute pancreatitis. The FCS market, at commercial orphan-disease pricing, represents peak revenue in the range of a few hundred million dollars annually. The commercial importance of REDEMPLO’s FCS approval is not the FCS market itself, it is that the approval establishes plozasiran’s regulatory foundation and commercial infrastructure for the much larger indications that follow.
The severe hypertriglyceridemia (sHTG) opportunity is where plozasiran becomes a major commercial asset. The SHASTA-3, SHASTA-4, and MUIR-3 Phase 3 trials complete in mid-2026, with supplemental NDA filing expected by year-end 2026. The FDA granted Breakthrough Therapy designation for plozasiran in sHTG in December 2025. sHTG is an addressable market measured in millions of patients globally, with peak revenue estimates in the multi-billion-dollar range at commercial pricing. Plozasiran’s head-to-head positioning against Ionis’s Tryngolza in sHTG, where Ionis cut pricing substantially in 2025, is developed in detail in the prior BioBoyScout analysis Redemplo vs. Tryngolza (March 2026). The summary conclusion is that plozasiran’s once-quarterly subcutaneous dosing profile and clinical efficacy support a two-winner market outcome at minimum.
Beyond plozasiran, the cardiometabolic franchise includes zodasiran (Phase 3 for homozygous familial hypercholesterolemia, an orphan indication with commercial optionality) and ARO-DIMER-PA, the first clinical-stage dual-functional RNAi therapeutic. ARO-DIMER-PA silences both PCSK9 and APOC3 genes in a single molecule, with Phase 1/2a dosing of the first subjects initiated January 2026 in mixed hyperlipidemia. Mixed hyperlipidemia is a high-prevalence disorder affecting millions, and the dual-gene approach represents a meaningful platform expansion, not just a new drug candidate but the first demonstration that TRiM can deliver dual-functional RNAi molecules. The commercial opportunity, if Phase 1/2a data supports advancement, is comparable to or larger than plozasiran’s mixed-hyperlipidemia opportunity in CAPITAN.
Figure 3: Non-ARO-MAPT Clinical-Stage Asset Inventory
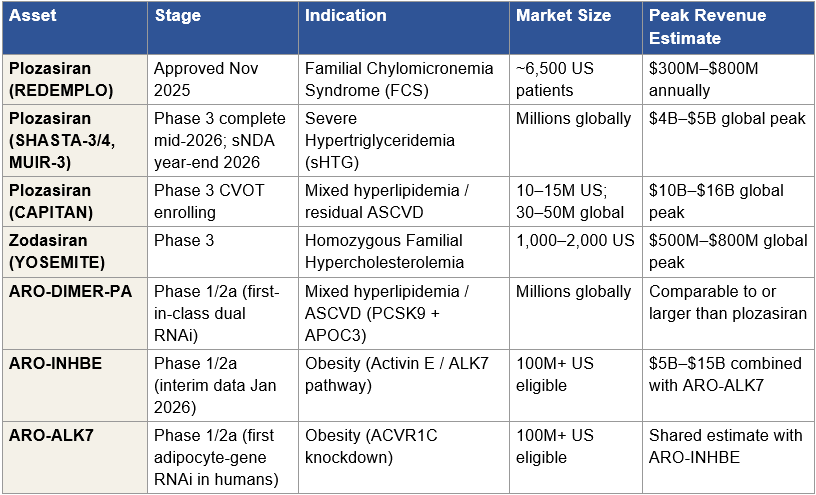
Figure 3: Clinical-stage assets in Arrowhead’s non-ARO-MAPT portfolio. Commercial infrastructure anchored by REDEMPLO (plozasiran) FCS approval; near-term expansion into sHTG and mixed hyperlipidemia through existing plozasiran trials; standalone obesity program with first human adipocyte-gene knockdown data. Partnered programs (Sarepta, Novartis, Takeda) are discussed separately below. Peak revenue estimates are industry-consensus ranges; probability-weighted rNPV treatment is developed in Section V.
The Obesity Program
Arrowhead disclosed interim Phase 1/2a data from ARO-INHBE and ARO-ALK7 in January 2026. Both programs target the Activin E / ALK7 pathway, a mechanism that is mechanistically distinct from GLP-1 receptor agonism and addresses specific limitations of current obesity standard-of-care: loss of lean mass, GI tolerability, reduced response in patients with diabetes, and disproportional fat mass regain after therapy cessation.
The interim data is clinically meaningful. ARO-INHBE monotherapy produced 9.9 percent visceral fat reduction at week 16 (single dose) and 15.6 percent placebo-adjusted visceral fat reduction at week 24 (two doses), with a 3.6 percent increase in lean muscle tissue. In combination with tirzepatide, ARO-INHBE approximately doubled weight loss and tripled reductions in visceral fat, total fat, and liver fat compared to tirzepatide alone in obese patients with type 2 diabetes. ARO-ALK7 became the first RNAi therapeutic to demonstrate knockdown of an adipocyte-expressed gene in humans, achieving 88 percent mean ALK7 mRNA reduction (94 percent maximum) and 14.1 percent placebo-adjusted visceral fat reduction from a single dose at week 8.
The strategic significance of the obesity program to an acquirer is material. Lilly and Novo Nordisk have built multi-billion-dollar franchises around GLP-1 mechanisms; both face pressure from next-generation approaches that address GLP-1’s limitations. An obesity asset that preserves lean mass, improves GLP-1 combination economics, and addresses the T2D subpopulation where GLP-1s underperform is commercially valuable as standalone or as a combination therapy with existing GLP-1 backbones. Arrowhead has stated its intention to keep both ARO-INHBE and ARO-ALK7 in-house through development, which means an acquirer of Arrowhead inherits both programs intact.
Additional Clinical Programs
Arrowhead’s pulmonary franchise, centered on ARO-RAGE for severe uncontrolled asthma and related indications, continues to advance through Phase 2. The complement franchise (ARO-C3, ARO-CFB) is in earlier stages but covers indications including IgA nephropathy, geographic atrophy in AMD, and paroxysmal nocturnal hemoglobinuria, each with multi-billion-dollar commercial potential in its primary indication. These programs do not carry the same magnitude of near-term catalyst value as plozasiran or the obesity candidates, but they contribute to the platform breadth that acquirers value.
Partnered Programs: Sarepta, Novartis, and Takeda
Arrowhead’s three largest active partnerships represent substantial inherited deal value for any acquirer.
The Sarepta Therapeutics agreement, closed February 2025, covers four clinical-stage programs (ARO-DUX4 for facioscapulohumeral muscular dystrophy, ARO-DM1 for myotonic dystrophy type 1, ARO-MMP7 for idiopathic pulmonary fibrosis, ARO-ATXN2 for spinocerebellar ataxia 2) plus three preclinical programs, with Sarepta able to nominate up to six additional targets during a five-year term. The transaction economics at closing included $500 million upfront, $325 million equity investment at $27.25 per share (a 35 percent premium at the time), $250 million in equal annual installments over five years, and up to $300 million in near-term milestones tied to ARO-DM1 Phase 1/2 enrollment progress. Total deal value, including all future milestones and royalties, is up to approximately $11 billion. Arrowhead also manufactures clinical drug supply for all programs and commercial drug product for the four clinical programs, which represents ongoing revenue-sharing economics that persist through commercial launches.
The Novartis agreement, closed October 2025, grants Novartis exclusive worldwide rights to ARO-SNCA, the alpha-synuclein siRNA for Parkinson’s disease and other synucleinopathies, plus additional collaboration targets. The transaction economics at closing included $200 million up front with up to $2 billion in potential milestone payments plus commercial royalties. The strategic significance of the Novartis deal is compounded by its use of the same subcutaneous CNS-delivery mechanism that underlies ARO-MAPT. Novartis’s commitment to ARO-SNCA at a preclinical stage, based on the delivery platform’s demonstrated non-human-primate data, is external validation of the same delivery mechanism whose translation to humans the Phase 1 ARO-MAPT readout will resolve.
The Takeda agreement on fazirsiran (ARO-AAT) for alpha-1 antitrypsin deficiency-associated liver disease is earlier-established but represents structurally different deal economics from Sarepta and Novartis. The program is actively enrolling in the 160-patient Phase 3 REDWOOD trial, with primary endpoint (≥1 stage reduction in liver fibrosis by biopsy) at week 102. Phase 2 SEQUOIA data showed 94 percent median reduction in hepatic Z-AAT accumulation, 68 percent mean reduction in histologic globule burden, and fibrosis regression in 50 percent of treated patients, results published in The New England Journal of Medicine. Fazirsiran carries FDA Breakthrough Therapy designation for AATD-LD. Deal economics provide Arrowhead with a 50/50 US profit share and tiered 20 to 25 percent royalties on ex-US net sales, a structurally more lucrative economic profile than the pure-royalty partnerships, and one that an acquirer inherits in full.
Beyond Sarepta, Novartis, and Takeda, Arrowhead maintains smaller partnerships and revenue streams from GSK, and Visirna/Sanofi (the latter for Greater China rights to plozasiran). Each contributes milestone and royalty streams; none individually moves the acquisition thesis, but collectively they demonstrate a pattern of institutional pharma validation of the TRiM platform across multiple therapeutic areas.
The Undisclosed Pipeline
Arrowhead presented preclinical data at the 7th Annual CNS Delivery Summit in December 2025 showing approximately 90 percent mRNA knockdown in non-human-primate brains for a deliberately undisclosed cardiometabolic target labeled Gene X. Other undisclosed programs exist across ocular TRiM delivery and cardiomyocyte TRiM delivery, tissue-specific delivery mechanisms that extend the platform’s validated range but have not been assigned to specific clinical candidates publicly.
These undisclosed programs do not appear in any sell-side model. They are the forward output of the platform engine. For an acquirer, they represent pre-disclosed optionality: a pipeline that is already producing at a rate the sell-side cannot model, priced into acquisition valuations because acquirers buy the engine, not just its current disclosed output.
What This Portfolio Establishes
Taken together, the non-ARO-MAPT portfolio establishes two things that the thesis depends on.
First, a non-CNS floor in the weak scenario.
If ARO-MAPT Phase 1 data fails the minimum thresholds developed in Section I, Arrowhead remains a commercial-stage company with an approved first-in-class RNAi therapeutic in plozasiran, near-approval sHTG expansion, a meaningful obesity program with human data, multiple clinical-stage programs in cardiometabolic and pulmonary indications, and ongoing milestone and royalty streams from Sarepta, Novartis, Takeda, and other partnerships. The probability-adjusted value of this business sits near today’s market cap, not dramatically above or below, which is what Section I’s weak scenario asserts.
Second, an acquisition-scenario addition beyond ARO-MAPT.
In the strong Phase 1 scenario, an acquirer is not paying $55 to $90 billion for ARO-MAPT alone. They are paying for ARO-MAPT plus plozasiran’s commercial trajectory, plus the obesity program with best-in-class potential in a mechanism GLP-1 incumbents do not own, plus the inherited Sarepta, Novartis, and Takeda deal economics, plus the platform engine’s undisclosed pipeline output. Each of these is modest individually compared to ARO-MAPT; together they account for a meaningful share of the acquisition range.
Before a single ARO-MAPT scenario is modeled, Arrowhead’s non-CNS portfolio supports a standalone acquisition value of $22 to $34 billion. This is the floor that bounds the weak-scenario downside and the foundation on which the ARO-MAPT acquisition premium is built.
V. Valuation Methodology
Large pharmaceutical acquisitions are valued using four methodologies in parallel, each producing a number that is then triangulated against the others. Understanding how M&A teams actually do this work helps calibrate the $55 to $90 billion Stage 1 acquisition range against defensible methodology rather than asserting it.
Each methodology answers a different question. rNPV asks what the asset is worth on its own cash flows. Peak revenue multiple asks what the market is paying for comparable assets on a revenue basis. Comparable transactions asks what acquirers have paid in similar situations. Monte Carlo asks what the probability distribution of outcomes looks like under realistic input ranges. An acquirer’s M&A team runs all four and looks for convergence. When the four methods converge on a similar range, the thesis is robust. When they diverge, something is off, either the inputs are mis-specified, or the strategic framework is wrong, or both.
Method 1: Risk-Adjusted Net Present Value (rNPV)
rNPV serves as the standalone baseline, the value of the target company operating independently, without acquirer synergies. The M&A team produces their own rNPV using their internal assumptions rather than relying on sell-side consensus, but the framework is similar to sell-side work: estimate peak revenue for each program, apply stage-dependent success probability, discount cash flows at a discount rate appropriate to the asset class, sum across the portfolio.
For Arrowhead, the bottom-up gross sum-of-parts is approximately $83 to $165 billion. Plozasiran franchise across all three indications (FCS approved, sHTG near approval, CAPITAN mixed hyperlipidemia CVOT) contributes approximately $22 to $34 billion on probability-weighted peak revenue. ARO-MAPT in Alzheimer’s disease, at conservative pre-catalyst probability assumptions of 20 to 25 percent at Stage 1, contributes approximately $32 to $54 billion. Orphan tauopathies (PSP, CBD, FTD-MAPT) contribute $8 to $18 billion. Partnered streams (Sarepta, Novartis, Takeda, and smaller agreements) contribute $8 to $18 billion in milestone and royalty-adjusted present value. Extended platform programs, including the obesity franchise, complement, pulmonary, and undisclosed programs, contribute $13 to $41 billion depending on which ones are assigned non-trivial probabilities. The distribution is wide because pipeline probabilities vary materially across assets and discount assumptions compound over long commercial horizons.
After applying a conservative 40 to 50 percent portfolio-level probability haircut, which reflects execution risk across the full asset inventory rather than treating every program’s success as independent, the standalone rNPV range is approximately $45 to $65 billion. An M&A team’s rNPV produces a substantially higher figure than sell-side consensus for three specific reasons. First, M&A teams apply asset-specific probability adjustments after data maturity events rather than industry base rates; sell-side CNS programs are typically assigned 10 to 15 percent probability of approval, while an M&A team looking at ARO-MAPT post-Phase-1 applies 20 to 25 percent because BIIB080 has validated MAPT-silencing mechanism in humans and trontinemab has validated TfR1-mediated BBB delivery. Second, M&A teams include platform optionality, undisclosed pipeline programs, manufacturing capacity, and partnered milestone streams that public-market models typically exclude or heavily discount. Third, M&A teams use discount rates that reflect the acquirer’s weighted cost of capital (8 to 10 percent) rather than the small-cap biotech risk premium sell-side analysts bake into their DCF models (12 to 15 percent). The cumulative effect produces an M&A-internal rNPV two to three times the sell-side consensus for the same underlying asset.
The $9.8 billion current market cap reflects a much deeper delivery-risk discount than even the probability-haircut rNPV supports. The gap between the current market cap and the $45 to $65 billion standalone rNPV range is the first piece of evidence for systematic mispricing. The gap between the $45 to $65 billion standalone rNPV and the $55 to $90 billion Stage 1 acquisition range is the synergy premium, addressed in a later subsection.
Method 2: Peak Revenue Multiple
M&A teams cross-check rNPV using peak revenue multiples drawn from comparable pharmaceutical transactions. Historical pharmaceutical acquisitions have transacted at 4 to 7 times peak revenue for validated-mechanism single-asset deals and 2 to 4 times peak revenue for diversified pipeline companies. The mechanism of this methodology is different from rNPV: it captures what acquirers have paid for the right to commercialize assets at scale, which implicitly includes both standalone cash flow value and some of the strategic premium that pure cash-flow discounting misses.
Arrowhead’s risk-adjusted peak revenue at Stage 1 is approximately $18 to $25 billion. Plozasiran franchise contributes $8 to $12 billion (FCS at a few hundred million, sHTG at $4 to $5 billion global peak, CAPITAN mixed hyperlipidemia at $3 to $7 billion risk-adjusted). ARO-MAPT across AD and orphan tauopathies contributes $10 to $13 billion at the 20 to 25 percent probability used in rNPV (which produces $8 to $10 billion from AD alone at peak) plus tauopathies at smaller but non-trivial contribution. Minor contributions from obesity, partnered streams, and other programs round out the estimate.
Applied to a 4 to 6 times multiple, the validated-mechanism range, appropriate for a company where the core assets are either approved, near-approved, or about to resolve a binary catalyst, this produces an enterprise value range of approximately $72 to $120 billion. The peak revenue multiple range runs higher than rNPV because it implicitly captures a portion of the strategic premium that rNPV excludes by construction. This is not a methodology error; it is a different question being answered. rNPV asks “what are the risk-adjusted cash flows?” Peak revenue multiple asks “what has the market paid for comparable revenue streams?” The two numbers should differ, and they do.
Method 3: Comparable Transaction Multiples
The comparable transaction framework anchors against market-cap multiples from closed pharmaceutical acquisitions. As developed in detail in Section II (Figure 2), validated-mechanism platform acquisitions have transacted at pre-data multiples of 6.5 to 12.6 times pre-data market cap in the four closest comparables: Prometheus 10.8×, MyoKardia 6.5×, Karuna 9.3×, ImmunoGen 12.6×. Each of these deals involved a catalyst-driven acquisition where a pharmaceutical acquirer paid a compound multiple that captured both the post-catalyst market re-rate and the acquisition premium.
Applied to Arrowhead’s current $9.8 billion market cap at a Stage 1 multiple range of 5.6 to 9.2 times, the comparable transactions methodology produces $55 to $90 billion in enterprise value. This range sits below the average historical multiple (which would produce approximately $95 billion at the midpoint) for two reasons. First, the restructured paper takes a conservative position on Stage 1 relative to the comparable set; the comparables average 9.8× pre-data multiple, while the paper uses 5.6 to 9.2× to reflect execution uncertainty and to leave room for Stage 2 and beyond. Second, Arrowhead’s pipeline breadth is greater than any single comparable, which moderates the per-asset multiple that would otherwise apply to a single-asset comparable.
The comparable transactions methodology is the most directly anchored of the four methods because it references actual deal consideration rather than modeled cash flows. An M&A team defending a $55 to $90 billion bid to a board uses the comparable transactions work first because it is the least theoretically contestable: the deals happened, the multiples are what they are, and the analytical question becomes whether Arrowhead’s structural characteristics justify placing the deal within, above, or below the comparable range. The paper’s position is that Arrowhead’s characteristics justify a placement within the range, anchored to the Stage 1 pre-data multiple.
Method 4: Monte Carlo Simulation
The fourth methodology is probabilistic rather than deterministic. Rather than produce a single enterprise value, Monte Carlo simulation runs 10,000 iterations varying key input assumptions across their stage-appropriate distributions: ARO-MAPT AD approval probability, peak revenue, discount rate, regulatory timing, pricing dynamics, competitive entry, platform success across non-disclosed programs. The output is a probability distribution of enterprise value outcomes, from which the M&A team identifies the range that defines a value-accretive bid.
Section VI develops the Monte Carlo in detail, including the input distributions and the resulting enterprise value percentiles. The summary at this level: the Monte Carlo median enterprise value at Stage 1 sits in the range of $75 to $105 billion, with the 25th to 75th percentile band spanning approximately $55 to $140 billion. The median range sits above the rNPV band and below the upper end of the peak revenue multiple band, which is the expected pattern when rNPV is conservative on probability inputs and peak revenue multiples capture partial strategic premium.
The Synergy Adjustment
The four standalone methodologies produce a distribution of standalone enterprise values, what the target is worth without reference to the specific acquirer. In any real M&A transaction, however, the final price reflects acquirer-specific synergies: the additional value that an asset generates when plugged into a particular acquirer’s infrastructure rather than operating standalone. This synergy premium is the difference between the standalone valuation and the acquisition price.
Stage 1 synergy values are acquirer-specific and substantial. For Lilly, the total synergy has two components. The first, AD-focused synergy, comprising Kisunla defensive value, the Kisunla + ARO-MAPT two-mechanism AD franchise pricing power, and commercial infrastructure integration, produces an estimated $30 to $50 billion. The second, obesity-focused synergy, comprising defensive value against competitor acquisition of Arrowhead’s obesity program, the tirzepatide + ARO-INHBE combination product economics (where January 2026 Phase 1/2a data showed doubled weight loss and tripled visceral/total/liver fat reductions versus tirzepatide alone), and commercial synergy across Lilly’s obesity auto-injector platform, produces an estimated $15 to $35 billion. Combined, Lilly’s Stage 1 synergy value is approximately $45 to $85 billion. For Roche, the trontinemab scientific coherence, the Elecsys diagnostic-therapeutic integration, and the Genentech antibody platform integration produce approximately $25 to $40 billion. For Novartis, the ARO-SNCA collaboration scaling and broader CNS expertise integration produces approximately $10 to $20 billion. Section X develops these synergy values in detail and defends the specific numbers against counter-arguments, including why Lilly’s two-franchise strategic fit produces a total synergy materially larger than the other bidders’.
In any negotiated acquisition, buyers capture 50 to 70 percent of synergy value for their own shareholders and pay 30 to 50 percent to sellers as the acquisition premium above standalone. Applied to the standalone valuation range and the synergy value range, the math produces the $55 to $90 billion Stage 1 acquisition range: a standalone valuation anchored around the $45 to $65 billion rNPV baseline, plus the seller’s captured share of acquirer-specific synergies, plus the competitive dynamic that drives bidders toward their maximum willingness to pay in an auction process.
Methodology Convergence
The four standalone methodologies and the synergy adjustment converge on the $55 to $90 billion Stage 1 range. Figure 4 consolidates the output of each methodology at Stage 1.
Figure 4: Methodology Convergence at Stage 1
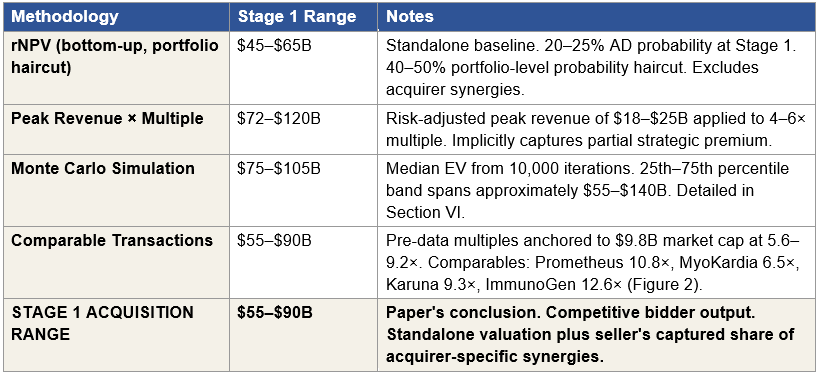
Figure 4: Four independent valuation methodologies applied at Stage 1, with the paper’s acquisition range for comparison. Each methodology uses independent inputs and assumptions. All four methodology ranges overlap the $55 to $90 billion Stage 1 conclusion: comparable transactions produces the range directly, peak revenue multiple fully contains it, Monte Carlo median sits in the upper band, and rNPV sits just below (reflecting the synergy premium excluded from standalone valuation).
The ranges produced by the four methodologies are not identical, nor should they be. Each methodology answers a different question and captures a different aspect of strategic value. What matters analytically is that all four methodology ranges overlap the $55 to $90 billion acquisition range, meaning every methodology individually produces outputs consistent with the paper’s conclusion. Two of the four (peak revenue and comparable transactions) fully contain the range. Monte Carlo’s median sits inside the upper band. rNPV sits just below, and the gap between rNPV and the acquisition range is the synergy premium that standalone valuation methodologies cannot capture by construction.
When four independent methodologies with different inputs and different theoretical bases produce ranges that converge on the same conclusion, the conclusion is robust. That convergence is the analytical signal that the $55 to $90 billion Stage 1 range is not the output of a single methodology’s assumptions but the consensus of the valuation framework pharmaceutical M&A teams actually use. It is the number an acquirer’s board would see if their team performed this work independently, which is a different claim than saying the market will arrive at this number through ordinary trading.
Four independent methodologies, rNPV plus synergy, peak revenue multiple, Monte Carlo, and comparable transactions, converge at a Stage 1 acquisition range of $55 to $90 billion under the strong Phase 1 scenario. Convergence from methodologies with no shared inputs is the strongest possible analytical signal that the range is structurally correct, not the output of any single model’s assumptions.
VI. Monte Carlo Distribution
The Monte Carlo simulation is the probabilistic counterpart to the deterministic methodologies in Section V. Rather than produce a single point-estimate enterprise value, it runs 10,000 iterations varying nine key input variables across stage-appropriate probability distributions, and reports the resulting enterprise value distribution by percentile. The exercise does two things that deterministic methods cannot. First, it quantifies the uncertainty around each of the four standalone methodology outputs, making clear which assumptions drive the largest swings in enterprise value. Second, it produces a probability-weighted answer to the question any acquirer’s M&A team has to answer for their board: what is the likelihood that a bid at a given price is value-accretive for the acquirer?
The Monte Carlo at pre-Phase-1 produces enterprise value ranges that are dramatically wider than the stage-conditioned ranges that follow each data resolution event. This is the central observation: at today’s information state, the uncertainty around Arrowhead’s fair value is enormous, because the single most consequential variable, ARO-MAPT’s probability of ultimate AD approval, has a pre-Phase-1 distribution that spans an order of magnitude of possible values. Phase 1 data collapses this distribution significantly, which is why the Phase 1 readout is the single largest re-rating event in the Arrowhead timeline.
The Driving Variable: ARO-MAPT AD Approval Probability
The single most consequential input in the Monte Carlo is ARO-MAPT’s probability of ultimate AD approval. This variable is scenario-conditioned: its distribution depends on the information state, which in the restructured framework depends on which of the three Phase 1 scenarios materializes.
At pre-Phase-1 (today’s information state), historical base rates for Phase 1 CNS programs produce a 10 to 15 percent probability of ultimate approval. For ARO-MAPT specifically, the argument for a higher probability rests on BIIB080 having validated MAPT-silencing mechanism in humans and trontinemab having validated TfR1-mediated blood-brain-barrier crossing in humans. These are real but partial validations. An appropriate pre-Phase-1 probability is 15 to 20 percent.
Under the strong Phase 1 scenario, delivery risk is retired by positive human CSF tau reduction data meeting or exceeding the BIIB080 benchmark, the probability that ARO-MAPT will silence MAPT in the human brain is no longer speculative. What remains uncertain is whether tau silencing translates to clinical benefit in a cognitive endpoint trial. The strong-scenario probability of ultimate approval is 20 to 25 percent. This reflects the real residual risk that tau knockdown, even at high magnitude, may not produce the cognitive benefit required for approval, a risk that BIIB080’s CELIA Phase 2 cognitive data will partially but not fully retire.
Under the moderate Phase 1 scenario, CSF tau reduction in the 40 to 55 percent range, mechanism validated without clear superiority to the BIIB080 benchmark, delivery is partially validated but the strength of efficacy signal is weaker. The moderate-scenario probability of ultimate approval is 12 to 18 percent, reflecting retained mechanism viability but compressed superiority assumptions.
Under the weak Phase 1 scenario, CSF tau reduction below 40 percent, tolerability issues, or insufficient BBB crossing evidence, the CNS platform thesis compresses materially. The weak-scenario probability of ultimate approval is 5 to 10 percent. At this level, AD expected value becomes a small contributor to total enterprise value, and the Monte Carlo distribution collapses toward the non-CNS floor.
Figure 5: Monte Carlo Input Variables and Distributions
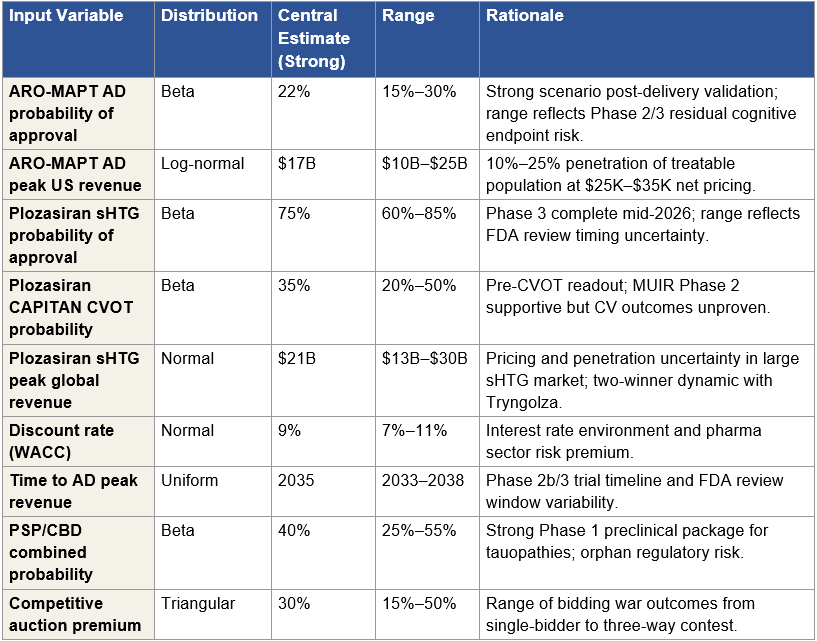
Figure 5: Nine input variables modeled in the Monte Carlo simulation. Central estimates and ranges correspond to the strong Phase 1 scenario. The probability of AD approval and peak AD revenue are the two highest-variance inputs and together drive approximately 60 percent of the distribution width. Moderate- and weak-scenario simulations use the same variable set with scenario-appropriate probability distributions (e.g., AD probability central estimate shifts to 15 percent for moderate, 7 percent for weak).
AD Probability Sensitivity: The Dominant Driver
Before examining the full nine-variable Monte Carlo output, it is useful to see the impact of the single most important variable in isolation. Figure 6 shows the AD indication expected value at different probability assumptions, holding peak revenue and multiple at their central estimates.
Figure 6: Sensitivity of AD Expected Value to Probability Assumption
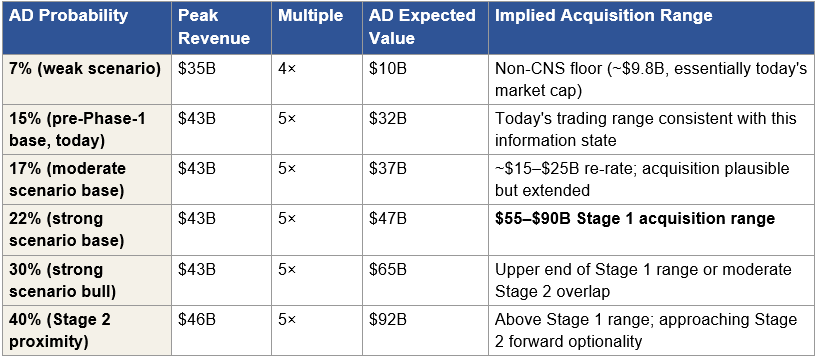
Figure 6: AD indication expected value as a function of probability assumption. The AD indication valuation is dominated by the probability assumption. Each row is internally coherent and represents a different information state. The 22 percent probability at Stage 1 reflects delivery risk retirement without cognitive endpoint confirmation. Individual investors who disagree with this assumption can substitute their own number and recalculate the acquisition range using this sensitivity table. The dominance of this single variable in the distribution motivates running a full Monte Carlo rather than relying on point estimates.
Scenario-Conditioned Enterprise Value Distribution
Figure 7 presents the full Monte Carlo output: enterprise value distribution percentiles under four information states, today (pre-Phase-1), and the three Phase 1 scenario outcomes. Each distribution is based on 10,000 simulations varying all nine input variables within their scenario-appropriate probability distributions.
Figure 7: Scenario-Conditioned Monte Carlo Enterprise Value Distribution
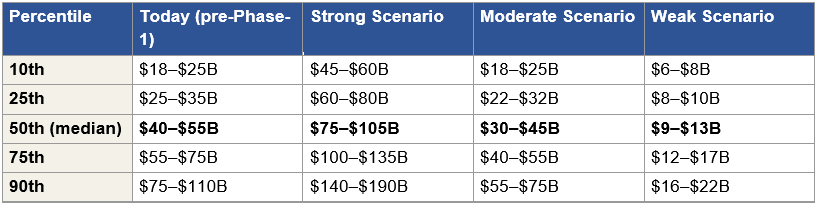
Figure 7: Monte Carlo enterprise value distribution by percentile, under four information states. Each distribution reflects 10,000 simulations with scenario-appropriate probability inputs. The median row, bolded, is the central output for each scenario. The distribution is right-skewed pre-Phase-1 because AD probability uncertainty is right-skewed; post-Phase-1 distributions are progressively less skewed as delivery and efficacy risk are retired. The acquisition price in any scenario falls below the enterprise value median, reflecting the competitive discount an acquirer captures by pricing below their maximum willingness to pay.
Figure 8: Enterprise Value Distribution by Scenario — Visual Comparison
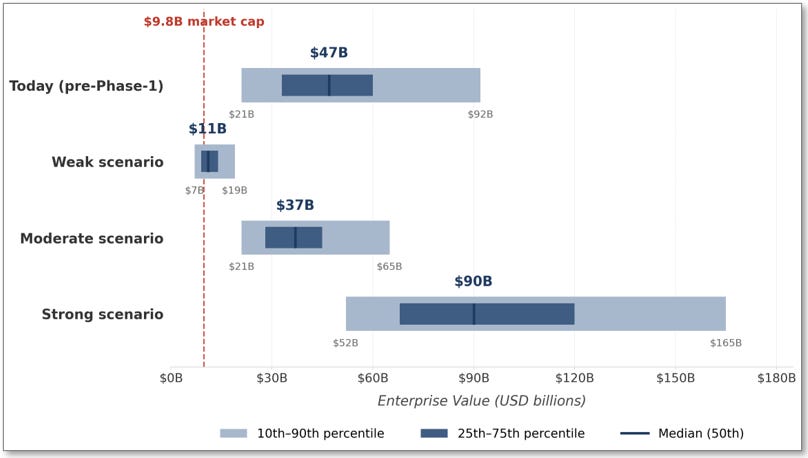
Figure 8: Monte Carlo enterprise value distribution visualized across four information states. The visual makes two observations immediately legible: first, Arrowhead trades today at approximately the 7th percentile of its own pre-Phase-1 distribution, far below the $47 billion pre-Phase-1 median; second, the jump from today’s median to the Strong scenario median is approximately 1.9×, the single largest repricing event in the Arrowhead timeline. The Weak scenario distribution is bounded near today’s market cap (the non-CNS floor), while the Moderate scenario median sits modestly below the pre-Phase-1 median and the Strong scenario median extends substantially above it.
Key Observations from the Distributions
Today’s market cap prices Arrowhead at roughly the 7th percentile of the pre-Phase-1 distribution.
The pre-Phase-1 Monte Carlo median is $40 to $55 billion, while Arrowhead trades at a $9.8 billion market cap. That valuation corresponds to approximately the outcome in which ARO-MAPT fails entirely and platform optionality evaporates, the scenario the prior evidence base developed in Section I argues against.
The Strong scenario median contains the $55 to $90 billion Stage 1 acquisition range.
The Strong scenario 50th percentile is $75 to $105 billion; the 25th percentile is $60 to $80 billion. The $55 to $90 billion Stage 1 acquisition range sits approximately at the 25th to 40th percentile of the Strong scenario distribution. This placement is the signature of a value-accretive acquisition: the buyer pays below the enterprise value median, which means the acquisition is value-accretive for the buyer in the majority of simulated outcomes. An acquisition priced at the median would require the seller to capture 100 percent of synergy, which does not happen in competitive auctions. The $55 to $90 billion range is where a rational acquirer’s board approves the bid because the probability of overpayment is bounded below 40 percent of the simulated distribution.
The Phase 1 readout is the single largest repricing event.
The jump from today’s $40 to $55 billion pre-Phase-1 median to the Strong scenario’s $75 to $105 billion median is approximately 1.8× to 1.9×. This is the single largest percentile-level re-rating in the Arrowhead timeline, larger than any subsequent data event would produce. The reason: Phase 1 retires the delivery risk that dominates the pre-Phase-1 uncertainty. After Phase 1, the remaining distribution is dominated by cognitive-endpoint uncertainty, pricing, and timing; all important, but none as consequential as the binary question of whether TfR1-mediated subcutaneous delivery produces meaningful tau silencing in humans.
The Moderate scenario still produces a meaningful re-rate.
The Moderate scenario median of $30 to $45 billion represents roughly a 3× to 4.5× lift from today’s $9.8 billion market cap. Even in the scenario where ARO-MAPT produces partial efficacy without superiority to the BIIB080 benchmark, the expected value math supports a meaningful positive return from today’s entry point. The Moderate scenario is not a failure, it is a reduced but still economically positive outcome.
The Weak scenario is bounded.
The Weak scenario median of $9 to $13 billion sits at or slightly above today’s $9.8 billion market cap. The 25th percentile is $8 to $10 billion; the 10th percentile is $6 to $8 billion. Even in the failure case, the distribution is bounded above today’s level at its median and does not collapse into single-digit-billion territory at the 25th percentile. This is the non-CNS floor that Section IV established, expressed in probabilistic terms: the commercial business anchored by plozasiran’s cardiometabolic franchise, the obesity program, and the partnered streams supports a floor valuation that approximately brackets today’s market cap.
Monte Carlo as Confirmation
The Monte Carlo output confirms the three other methodologies from Section V. rNPV ($45 to $65 billion standalone) sits below the Strong scenario Monte Carlo median ($75 to $105 billion), with the gap representing the synergy premium that standalone valuation excludes by construction. Peak revenue multiple ($72 to $120 billion) overlaps the Strong scenario 50th to 75th percentile band. Comparable transactions ($55 to $90 billion) aligns with the Strong scenario 25th to 40th percentile band, which is precisely the band where value-accretive acquisition pricing occurs. The four methodologies converge because the underlying analytical framework they share, probability-weighted asset valuation, strategic premium, competitive bidder dynamics, produces consistent outputs regardless of which methodology is used to generate the point estimate.
What the Monte Carlo adds beyond the deterministic methods is the probability context. An acquirer’s M&A team uses the Monte Carlo to answer the question the board asks: what is the probability that our bid is value-accretive? For a bid at $55 billion, the probability of overpayment against the Strong scenario distribution is approximately 10 to 15 percent, the bid sits near the 15th percentile. For a bid at $90 billion, the probability of overpayment is approximately 35 to 45 percent, the bid sits near the 40th percentile. The range between these two bounds is the $55 to $90 billion Stage 1 acquisition range, and the probability of overpayment across the range is bounded below 50 percent under every simulated input combination. That is the analytical condition that makes the bid approvable at an acquirer’s board. It is also the analytical condition that does not hold at Arrowhead’s current $9.8 billion market cap, a point where the probability of overpayment is essentially zero but the probability of underpayment exceeds 90 percent.
The pre-Phase-1 Monte Carlo median is $40 to $55 billion. Arrowhead trades at $9.8 billion, approximately the 7th percentile of the simulation output. The market is pricing Arrowhead today as if the weak scenario, the outcome in which ARO-MAPT fails entirely, were the probability-weighted base case.
VII. The Three Scenarios
Section I introduced the three Phase 1 readout scenarios as a framework for pricing the investment today. Sections IV through VI built the valuation machinery that each scenario implies. This section narrates what each scenario actually looks like in practice: how the data reads out, how the market reacts, what strategic response each scenario produces from potential bidders and from Arrowhead management, and where the investor ends up across each path through 2030.
The three scenarios are defined by the Phase 1 CSF tau reduction threshold relative to the BIIB080 high-dose MAD benchmark of 51 to 56 percent. A strong readout meets or exceeds that benchmark. A moderate readout produces tau reduction in the 40 to 55 percent range with durability or tolerability questions that prevent clear superiority. A weak readout falls below 40 percent, reveals tolerability issues, or shows insufficient blood-brain-barrier crossing evidence. The sections that follow describe each scenario’s chronology from the readout day forward. Figure 9 summarizes the three trajectories at key milestones for reference.
A note on the scenarios that follow.
The narratives in this section and in the bidder, licensing, and auction sections that follow describe analytical hypotheticals constructed for illustrative and valuation purposes only. Specific outcomes, stock price movements, acquisition timing, bidder behavior, licensing structures, are conditional forecasts derived from publicly available information about the named companies’ strategic positioning, financial capacity, and pipeline logic, and from historical patterns in comparable pharmaceutical acquisitions. Nothing in this section reflects non-public communications, insider knowledge, or actual acquisition or licensing discussions involving Arrowhead Pharmaceuticals or the companies named. Investment banks mentioned as potentially engaged in an M&A process are identified by industry practice and historical precedent, not by any information about Arrowhead’s advisor relationships. Individual investors should evaluate these scenarios against their own probability assumptions and risk tolerance.
Figure 9: Scenario Trajectories Through 2030
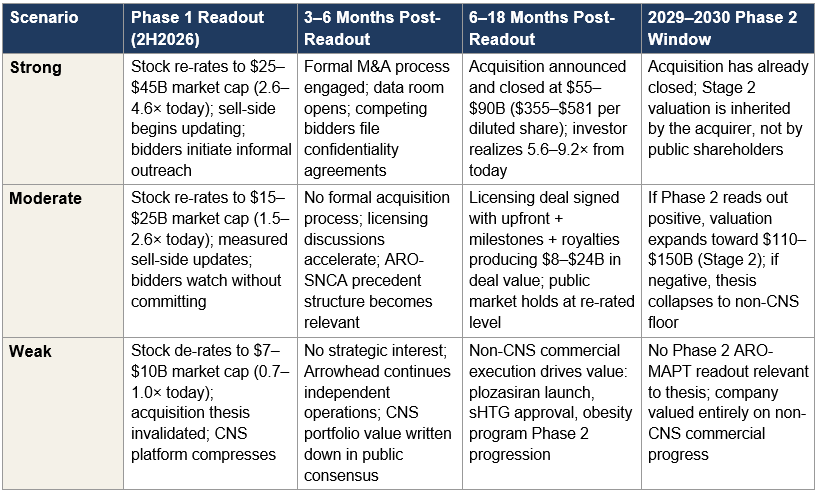
Figure 9: Key milestones and outcomes under each Phase 1 readout scenario. The columns map the temporal progression from the Phase 1 readout forward through the 2029–2030 Phase 2 cognitive endpoint window. The narrative subsections that follow describe each scenario in detail.
The Strong Scenario: Positive Phase 1 Data and the Acquisition Path
The data.
ARO-MAPT Phase 1 reports CSF tau reduction of 55 percent or higher, sustained through at least 12 weeks post-dose, with clean tolerability and dose-dependent biomarker engagement across multiple cohorts. The data demonstrates ARO-MAPT is at least on par with, and probably superior to, Biogen/Ionis’s BIIB080 high-dose MAD benchmark of 51 to 56 percent. Critically, the tolerability profile shows no hepatotoxicity signals from off-target TfR1 binding in liver, no neurotoxicity from non-neuronal brain cell uptake, and no dose-limiting safety findings. The subcutaneous delivery route is validated. The mechanism works in humans.
The market reaction.
The stock opens halted before market open on the readout day. The press release goes out pre-market. When trading resumes, the stock opens 100 to 200 percent higher on the first print. Over the following three to five trading sessions, as sell-side analysts scramble to update models and institutional investors re-allocate, the market cap settles in the $25 to $45 billion range, a 2.6 to 4.6 times re-rate from today’s $9.8 billion. The initial re-rate is driven by probability revision: ARO-MAPT’s probability of ultimate approval moves from the pre-Phase-1 base of 15 to 20 percent to the post-strong-Phase-1 range of 20 to 25 percent, and the full platform valuation compounds because delivery risk retirement validates every CNS program in the pipeline, not just ARO-MAPT.
The sell-side response.
Sell-side analysts update their price targets over the two to four weeks following the readout. The first analyst to publish a conditional acquisition-value note, the one-paragraph scenario described in Section III, becomes the most-read research piece on the stock that year. The other analysts are forced to respond: either engage with the conditional acquisition framework or explicitly reject it. The market begins to price the acquisition optionality that it has, to this point, been ignoring. Re-rated consensus targets cluster in the $160 to $290 per share range by the end of the first post-readout quarter, consistent with the strong-case market cap developed in Section I.
The strategic response from bidders.
Within the first 72 hours of the readout, informal outreach from potential acquirers begins. The initial contacts are by bankers, not company executives, standard pre-transactional practice that preserves optionality without creating disclosure obligations. By the end of the first post-readout month, the potential bidders identified in Section VIII (Lilly, Roche, and Novartis) have each engaged their M&A teams to perform independent valuation work. By months two to four, at least two of the three bidders have signed confidentiality agreements with Arrowhead and gained access to a data room. The company’s bankers, the major pharmaceutical M&A specialists at firms like Centerview, Goldman Sachs, and Morgan Stanley, are engaged to run a formal process. The CEO and board weigh the strategic options: remain independent, license ARO-MAPT, or sell the company. With multiple bidders engaged and public market pressure building for liquidity realization, the path of least resistance is a sale process.
The auction window.
Over months four through twelve, the auction develops. Each bidder performs detailed due diligence on the clinical, regulatory, manufacturing, and commercial dimensions of the company. The process is competitive because the synergy math differs materially across the three bidders, as Section V outlined: Lilly’s total synergy value of $45 to $85 billion (AD plus obesity) gives Lilly the highest maximum bid ceiling. Roche’s $25 to $40 billion synergy and Novartis’s $10 to $20 billion put them in the bidding but at lower ceilings. The auction mechanics detailed in Section XI describe how this competitive dynamic converges on the $55 to $90 billion clearing price, anchored to comparable transaction multiples, consistent with the Monte Carlo 25th to 40th percentile of the Strong scenario distribution, and inside Lilly’s maximum willingness to pay with room for competing bids to push toward the upper end of the range.
The terminal outcome.
The acquisition is announced 6 to 18 months after the Phase 1 readout. The announcement includes a cash bid, or cash-and-stock in some structures, at a per-share price of $355 to $581 on a fully diluted basis, corresponding to the $55 to $90 billion total enterprise value. Hart-Scott-Rodino antitrust clearance proceeds in parallel with shareholder approval proxies. The transaction closes within three to nine months of announcement. The investor who entered at today’s $9.8 billion market cap realizes a return of 5.6 to 9.2 times their initial capital, delivered over a window of roughly 18 to 30 months from today. The company’s commercial operations continue under the acquirer’s ownership. The platform engine, including the undisclosed pipeline programs, is now deployed inside the acquirer’s infrastructure. Stage 2, the forward optionality that would have opened at Phase 2 cognitive data in 2029–2030, accrues to the acquirer, not to public shareholders. The public market chapter of Arrowhead’s story ends.
The Moderate Scenario: Partial Efficacy and the Licensing Path
The data.
ARO-MAPT Phase 1 reports CSF tau reduction in the 40 to 55 percent range, mechanism validated in humans, but without clear superiority to the BIIB080 high-dose MAD benchmark. Either the higher-end numbers are achieved but with durability questions (post-dose tau rebound before the 12-week readout), or the more sustained numbers are achieved only at the lower end of the tau reduction range. Tolerability may be acceptable or may show minor signals that raise questions at higher doses. The data is consistent with a working mechanism but does not decisively establish best-in-class potential. The investment thesis survives; the magnitude of the upside compresses.
The market reaction.
The stock opens meaningfully higher but not at the strong-case level. Over the following trading sessions, the market cap settles in the $15 to $25 billion range, a 1.5 to 2.6 times re-rate from today’s $9.8 billion. The initial re-rate is driven primarily by delivery validation (the mechanism demonstrates human efficacy, which matters for the entire CNS platform) and secondarily by modest probability improvement on ARO-MAPT AD approval, with the probability moving from the pre-Phase-1 base of 15 to 20 percent to the moderate-scenario range of 12 to 18 percent. The apparent inconsistency, a re-rate despite lower probability than pre-Phase-1, resolves when decomposed: the mechanism validation produces platform-wide value even as cognitive-endpoint risk keeps AD probability compressed.
The strategic response.
Moderate data does not produce a formal M&A auction. Bidders watch closely but do not engage bankers. The reasoning is straightforward: a bidder paying a strong-case acquisition premium for moderate-case data is overpaying against both standalone rNPV and against the probability-adjusted expected value. Bidders instead wait for Phase 2 cognitive data to resolve the efficacy question. Arrowhead management, recognizing that acquisition dynamics are unavailable in the moderate scenario, pivots to licensing. The ARO-SNCA deal structure with Novartis from October 2025, $200 million upfront, $2 billion in milestones, royalties on commercial sales, becomes the template for an ARO-MAPT licensing transaction. Section IX develops the licensing path economics; the summary is that a moderate-data ARO-MAPT licensing deal can extract $8 to $24 billion in probability-adjusted deal value for the ARO-MAPT program alone, preserving the non-ARO-MAPT portfolio entirely under Arrowhead’s independent control.
The terminal outcome before Phase 2.
Within 12 to 18 months of the Phase 1 readout, a licensing transaction is announced. The deal structure includes an upfront payment (approximately $500 million to $1.5 billion), milestone payments tied to Phase 2 and Phase 3 success ($2 to $4 billion total), and tiered royalties on commercial sales (mid-to-high teens). The licensing partner is typically one of the three strategic buyers identified in Section VIII, most plausibly Roche or Lilly, but could be a fourth player like Biogen, which already has BIIB080 and would view ARO-MAPT as a complementary subcutaneous alternative. The public market continues to hold Arrowhead at the re-rated $15 to $25 billion level through the licensing announcement, then trades in a range as investors price the licensing economics against Phase 2 optionality. The investor who entered at today’s $9.8 billion market cap realizes a 1.5 to 2.6 times return on the market cap re-rate plus some portion of the licensing upfront and near-term milestone economics as they accrue to Arrowhead’s balance sheet.
The Phase 2 resolution window.
Phase 2 cognitive endpoint data reads out in 2029 or 2030. At that point, the moderate scenario bifurcates. If Phase 2 is positive, ARO-MAPT demonstrates that its moderate-magnitude tau silencing produces clinical cognitive benefit, the licensing economics trigger additional milestones, the partnered asset advances toward approval, and Arrowhead’s valuation expands toward the $110 to $150 billion Stage 2 range. The licensing partner may also initiate acquisition discussions at that point; the Stage 2 acquisition dynamics, while not modeled in detail in this paper, represent additional forward optionality. If Phase 2 is negative, tau silencing does not translate to cognitive benefit, the thesis collapses, Arrowhead’s ARO-MAPT royalty stream becomes substantially less valuable, and the stock re-rates downward toward the non-CNS floor of approximately $7 to $10 billion market cap. The moderate scenario is therefore not a single terminal outcome but a branching path with Phase 2 as the definitive resolution event.
The Weak Scenario: Failed Data and the Non-CNS Floor
The data.
ARO-MAPT Phase 1 reports CSF tau reduction below 40 percent, or tolerability issues that call the mechanism into question, or insufficient blood-brain-barrier crossing evidence. This threshold sits clearly below BIIB080’s 51 to 56 percent high-dose MAD benchmark and above BIIB080’s low-dose failure zone of approximately 30 percent, but only by a margin that would not support commercially competitive subcutaneous quarterly tau silencing. Alternatively, the data may show acceptable tau reduction but reveal safety signals that cap the dose at levels insufficient for commercial therapeutic effect. In any of these variants, the CNS platform thesis compresses materially.
The market reaction.
The stock opens sharply lower. Over the following trading sessions, as the market digests the data and re-prices the CNS platform thesis, the market cap de-rates to the $7 to $10 billion range, a 0.7 to 1.0 times multiple of today’s $9.8 billion valuation. The de-rate is bounded at that level because the non-CNS commercial business remains intact: plozasiran is already commercial for FCS, the sHTG Phase 3 program is complete and awaiting regulatory approval, the obesity program has meaningful Phase 1/2a human data, and the partnered streams from Sarepta, Novartis, and Takeda continue to produce milestone and royalty economics. The weak scenario de-rate reflects a collapse in the CNS platform valuation, not a collapse in the company’s overall commercial viability. Section IV established the non-CNS floor in asset-inventory terms; the weak scenario de-rate is the market’s probabilistic expression of that floor.
The strategic response.
No acquisition process develops in the weak scenario. The core thesis that motivated the $55 to $90 billion Stage 1 range, validated subcutaneous CNS delivery supporting a platform that includes ARO-MAPT, ARO-SNCA, and undisclosed CNS programs, does not hold under weak Phase 1 data. Bidders who had performed preliminary valuation work on the strong scenario deactivate those files. Arrowhead management pivots the strategic narrative from CNS platform validation to cardiometabolic commercial execution: plozasiran launch, sHTG approval, CAPITAN CVOT read-out, obesity program advancement, ARO-DIMER-PA Phase 1/2a progression. The Sarepta partnership remains intact but loses its subcutaneous-CNS-validation halo; the Novartis ARO-SNCA deal enters a challenging period because the underlying delivery mechanism thesis has been partially invalidated. The company’s earnings calls reset expectations around cardiometabolic revenue trajectory rather than CNS platform optionality.
The terminal outcome.
Over the 6 to 18 months following a weak readout, the market settles Arrowhead at a valuation consistent with a cardiometabolic-focused commercial-stage biotech with a first-in-class FCS approval, a Phase 3-complete sHTG program, an obesity program with encouraging early data, and an active CVOT. This business is real and commercially viable; the weak scenario does not produce a failing company, it produces a company without the CNS platform optionality that made the thesis transformative. Probability-adjusted valuation sits in the $9 to $13 billion range per the Section VI Monte Carlo median for the weak scenario. The investor who entered at today’s $9.8 billion market cap realizes a modestly positive to modestly negative outcome depending on where within the weak distribution the market settles. The downside is bounded, not zero, but bounded. This is the asymmetry that makes entry today attractive: the weak scenario loses roughly what the moderate scenario gains on a percentage basis, while the strong scenario produces multiples that are not available anywhere else in the distribution of outcomes.
The Asymmetric Entry Point
The three scenarios are not equally probable. Section I argued that the prior evidence base, BIIB080’s human MAPT-silencing validation, trontinemab’s human TfR1-mediated BBB delivery validation, Arrowhead’s non-human-primate CSF tau reduction data, and the Phase 1 dose escalation design, reduces the probability of the weak scenario below what today’s $9.8 billion market cap implies. Section VI’s Monte Carlo simulation quantified this gap by placing today’s valuation at roughly the 7th percentile of the pre-Phase-1 distribution, well below the $40 to $55 billion pre-Phase-1 median.
The asymmetry of the trade can be stated compactly. Entering at today’s market cap, the investor’s payoff profile across the three scenarios is approximately: strong scenario produces 5.6 to 9.2 times return with an acquisition in 6 to 18 months; moderate scenario produces 1.5 to 2.6 times re-rate with additional licensing economics and a Phase 2 branching path that could reach Stage 2 valuations; weak scenario produces approximately 0.7 to 1.0 times outcome bounded by the non-CNS floor. The geometric mean across the three scenarios under any reasonable probability weighting exceeds 2 times from today’s entry point, and the upside distribution has a tail that extends well beyond any typical late-stage biotech investment.
The Phase 1 readout is the single event that resolves the distribution. Before the readout, the investor is buying a probability-weighted claim on all three scenarios. After the readout, the scenario is revealed and the asymmetric entry point is no longer available. The scenarios that follow from this section, which specific bidders execute the strong-scenario acquisition, what the licensing path looks like under the moderate scenario, what the auction dynamics produce at the $55 to $90 billion clearing price, develop the analytical detail behind each outcome path, but the investment decision is made today, against the probability distribution of outcomes, before the data arrives.
Strong data produces a probable $55 to $90 billion acquisition within 6 to 18 months. Moderate data produces a $15 to $25 billion re-rate with licensing as a realistic alternative. Weak data produces a non-CNS floor at roughly today’s market cap. The probability-weighted expected value from today’s entry point is decidedly positive.
VIII. The Strategic Buyers
The bidder profiles in this section describe the three strategic buyers most likely to compete for Arrowhead in the strong Phase 1 scenario: Eli Lilly, Roche, and Novartis. The analysis below is subject to the disclaimer in Section VII; the profiles are analytical hypotheticals constructed from publicly available information about each company’s strategic positioning, financial capacity, and pipeline logic, and do not reflect any non-public communications, insider knowledge, or actual acquisition discussions.
The final acquisition price in a competitive auction is determined not by what the asset is worth in the abstract, but by what the most motivated bidder is willing to pay to win and what the second-most motivated bidder is willing to pay. Arrowhead in the strong Phase 1 scenario has three bidders with acquisition-scale financial capacity and distinct strategic rationales, which is structurally rare in pharmaceutical M&A. Figure 10 maps the three bidders on two dimensions: strategic motivation (how much each needs the asset) and financial capacity (whether each can execute at Stage 1 scale). All three occupy the high-capacity quadrant; they differ in the strength and specificity of their strategic motivation, which determines probability of winning and maximum willingness to pay.
Figure 10: Bidder Landscape
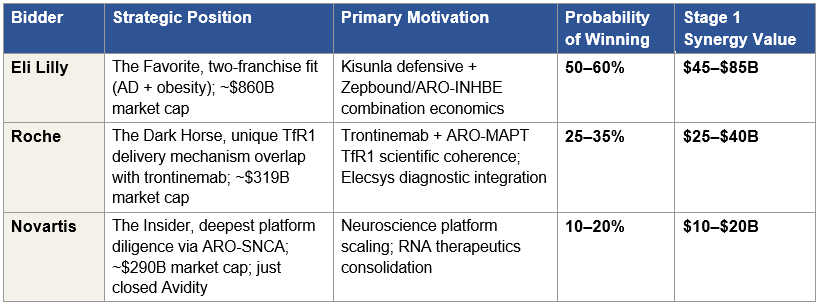
Figure 10: Three strategic bidders positioned on motivation, probability, and synergy value. All three have acquisition-scale financial capacity. Stage 1 synergy values are the Section V estimates of acquirer-specific value creation above the standalone rNPV of Arrowhead. Probability of winning sums to 85–115%, with the residual reflecting low-probability outcomes not modeled here (consortium bids, unexpected fourth parties, or a non-acquisition outcome under strong-scenario data). Probabilities are conditional on the strong Phase 1 scenario; in moderate or weak scenarios, the competitive auction dynamic does not develop. The probability allocations reflect the author’s synthesis of strategic fit, financial capacity, and competitive urgency across the three bidders. Reasonable alternative assessments could shift the allocation materially, particularly between Lilly and Roche, without changing the core claim that a competitive auction develops and clears in the $55 to $90 billion range.
Eli Lilly: The Two-Franchise Strategic Fit
Strategic position.
Lilly is the dominant pharmaceutical company in two of the three therapeutic areas most relevant to Arrowhead’s strategic value: Alzheimer’s disease, where Kisunla (donanemab) is the established first-line anti-amyloid therapy with its distinctive “finite therapy” stop-dosing protocol; and obesity, where Zepbound and Mounjaro together capture approximately 60 percent of new US GLP-1 prescriptions. Lilly’s market capitalization crossed $1 trillion in late 2025, the first pharmaceutical company to reach that threshold, before pulling back approximately 15 percent, and currently sits at approximately $860 billion. The balance sheet, cash generation, and equity currency available to Lilly for acquisitions remain the largest in the industry.
The AD motivation.
Kisunla is commercially established but faces mechanism-specific limitations that an AD franchise should address. Amyloid clearance produces meaningful slowing of cognitive decline, but tau pathology continues to progress, and patients who stop Kisunla after plaque clearance still decline if their tau burden is high. A subcutaneous anti-tau therapy administered quarterly, which is what ARO-MAPT would be if the strong Phase 1 scenario materializes, combines mechanistically with Kisunla to produce a two-mechanism AD franchise addressing both hallmark pathologies. This combination is uniquely available to Lilly because Lilly owns the anti-amyloid side. No competitor can fully replicate the combination without either licensing Kisunla from Lilly (unlikely) or developing a competitive anti-amyloid therapy from scratch (time-prohibitive). The defensive value is equally important: if a competitor acquires Arrowhead, the competitor owns the anti-tau side of a two-mechanism franchise that positions against Kisunla. Lilly’s estimated AD-focused synergy value is $30 to $50 billion, comprising Kisunla defensive protection, two-mechanism franchise pricing power, and commercial infrastructure integration across the AD sales force, prescriber education programs, and payor contracts Lilly has already built.
The obesity motivation.
Lilly has won the first generation of the GLP-1 wars, but the second-generation competitive question is different. As patents mature, payor pressure mounts, and new mechanisms emerge, the durability of Zepbound’s franchise depends on Lilly’s ability to evolve beyond pure GLP-1 agonism. Arrowhead’s obesity program, ARO-INHBE targeting Activin E and ARO-ALK7 targeting ALK7, operates through a mechanistically distinct pathway (non-GLP-1) and addresses structural limitations of GLP-1 therapy including lean muscle mass loss, GI tolerability, and weight regain after cessation. In January 2026, interim Phase 1/2a data from ARO-INHBE combined with tirzepatide showed doubled weight loss and tripled visceral, total, and liver fat reductions compared to tirzepatide alone. If those data replicate in pivotal trials, a Lilly-owned tirzepatide + ARO-INHBE combination product extends the Zepbound franchise beyond its patent cliff and commands premium pricing for second-line positioning. The defensive value is substantial: if Novo Nordisk or another competitor acquires the Arrowhead obesity program, Lilly faces a direct combinatorial threat to its dominant obesity franchise. The obesity-focused synergy value is $15 to $35 billion, comprising the combination product economics, defensive protection, and auto-injector commercial platform synergy.
The two-franchise argument.
Combined, Lilly’s Stage 1 synergy value is approximately $45 to $85 billion, materially larger than Roche’s ($25 to $40 billion) or Novartis’s ($10 to $20 billion). The reason is structural rather than aggressive: Lilly has two strategic franchises where Arrowhead’s pipeline creates value, while Roche has one (AD via trontinemab) and Novartis has one (neuroscience via ARO-SNCA). This two-franchise strategic fit is why Lilly is the highest-probability winner and why Lilly’s maximum willingness to pay can reach the upper end of the Stage 1 range. Section X develops the synergy decomposition in detail and makes the case that Lilly’s standalone bid capacity alone can exceed $100 billion when the full synergy captured by the seller is added to the standalone rNPV, though the paper holds the $55 to $90 billion range as the competitive-auction clearing price anchored to comparable transactions rather than to Lilly’s maximum willingness to pay in isolation.
Track record and execution.
Lilly under CEO Dave Ricks has a consistent pattern of paying premium prices for validated platforms and executing decisively when diligence confirms the strategic thesis, including the Loxo Oncology, Prevail Therapeutics, and Verve Therapeutics acquisitions. A Stage 1 Arrowhead acquisition fits this pattern; validated human CNS delivery, two-franchise strategic fit, and platform breadth that justifies paying above pure financial valuation. The estimated probability of Lilly winning a competitive auction for Arrowhead in the strong Phase 1 scenario is 50 to 60 percent.
Roche: The Trontinemab Coherence
Strategic position.
Roche operates the most comprehensive AD development portfolio of any pharmaceutical company and has returned to Alzheimer’s with a novel therapeutic approach that differentiates structurally from first-generation anti-amyloid antibodies. Trontinemab, developed through Roche’s Brainshuttle antibody engineering platform, uses a transferrin receptor (TfR1) binding fragment attached to the gantenerumab antibody to cross the blood-brain barrier via receptor-mediated transcytosis. The Phase 3 TRONTIER 1 and TRONTIER 2 studies initiated in late 2025, enrolling approximately 1,600 patients with primary completion in June 2030; a separate PrevenTRON Phase 3 in preclinical AD is also planned. Roche’s market capitalization is approximately $319 billion on trailing twelve-month revenue of $76 billion.
The TfR1 mechanism overlap.
The most consequential synergy available to Roche but to no other bidder is the delivery mechanism overlap between trontinemab and ARO-MAPT. Trontinemab crosses the blood-brain barrier by binding TfR1 on BBB endothelial cells. ARO-MAPT crosses the blood-brain barrier by binding TfR1 on BBB endothelial cells. Same receptor, same crossing mechanism, complementary therapeutic payloads: trontinemab removes amyloid, ARO-MAPT silences tau. A Roche-owned combination of the two assets produces the only two-mechanism Alzheimer’s franchise where both drugs use TfR1-mediated BBB transcytosis as their delivery route. The scientific coherence is unique; no other bidder has TfR1-validated CNS delivery in their own pipeline. The combination could support sequential or co-administered dosing protocols, manufacturing economies of scale around TfR1 binding domain production, and shared clinical development infrastructure for BBB-crossing therapeutics across Roche’s broader CNS pipeline. The trontinemab-specific component of Roche’s synergy value is estimated at $5 to $15 billion.
The Elecsys diagnostic integration.
Roche Diagnostics is the world leader in laboratory diagnostics and has invested heavily in Alzheimer’s blood-based biomarker tests including the Elecsys pTau-217 assay now integrated into TRONTIER screening, the pTau-181 plasma test (FDA-approved October 2025 for primary care use), and complementary amyloid-beta ratio assays. A Roche-owned ARO-MAPT combined with Roche-owned Elecsys diagnostics produces an integrated patient-identification-to-therapy workflow where Roche captures economics at multiple points: diagnostic testing volumes, companion diagnostic-therapeutic pricing power, and vertical integration of the AD patient journey. Lilly has diagnostic partnerships but does not own equivalent infrastructure; the Elecsys co-development with Lilly under the 2023 partnership shares diagnostic access, not ownership. The Elecsys integration synergy is estimated at $10 to $20 billion.
The constraints.
Two considerations temper the Roche probability below Lilly’s. First, financial capacity. Roche’s $319 billion market cap is substantial but materially smaller than Lilly’s ~$860 billion, and a $55 to $90 billion Stage 1 acquisition would represent 17 to 28 percent of Roche’s market cap versus 6 to 10 percent of Lilly’s. Roche can execute the transaction but will require more debt financing and may face greater shareholder scrutiny on the near-term dilutive impact. Second, strategic priority. Roche’s trontinemab is already a Phase 3 anti-amyloid asset that management has substantial conviction in; a Roche-owned ARO-MAPT would complement trontinemab, but Roche can also pursue AD leadership with trontinemab alone if the cost-benefit of an Arrowhead acquisition exceeds internal thresholds. Lilly cannot similarly decline to compete because Lilly’s AD franchise is already commercial and the threat of a competitor owning the tau-silencing asset is more acute. Combined, Roche’s Stage 1 synergy value is $25 to $40 billion, and the estimated probability of Roche winning a competitive auction is 25 to 35 percent.
Novartis: The Platform Insider
Strategic position.
Novartis has pursued an explicit neuroscience-by-M&A strategy, publicly articulated at the January 2026 J.P. Morgan Healthcare Conference: the company intends to win in neuroscience through acquisitions and licensing rather than purely through internal development. Two recent transactions execute this strategy. In October 2025, Novartis announced the $12 billion cash acquisition of Avidity Biosciences, bringing a muscle-directed RNA delivery platform and three late-stage neuromuscular programs; the transaction closed February 27, 2026. Earlier in 2025, Novartis announced the $1.7 billion acquisition of Regulus Therapeutics. Beyond acquisitions, Novartis has executed the most substantial licensing deal with Arrowhead to date: the October 2025 ARO-SNCA agreement for $200 million upfront, up to $2 billion in milestones, and tiered royalties on global sales. Novartis’s market capitalization is approximately $290 billion on trailing twelve-month revenue of $57 billion.
The platform insider advantage.
The ARO-SNCA transaction gives Novartis the deepest external diligence of any potential acquirer. The BD and R&D teams that evaluated ARO-SNCA have spent meaningful time inside Arrowhead’s TRiM platform, understand the chemistry of the TfR1 ligand conjugate subcutaneous CNS delivery mechanism as well as any external party can, and have already approved the platform at a level that committed $200 million in upfront capital plus up to $2 billion in contingent consideration to a single program. From Novartis’s perspective, Arrowhead is not a blind diligence target. It is a known platform with a specific commercial and scientific track record. This lowers execution risk and shortens the diligence window that would otherwise be required for a Stage 1 acquisition. The insider advantage translates directly to probability of executing at speed in a competitive auction.
The mitigating factors.
Two factors temper the Novartis probability below Roche’s, despite the platform insider advantage. First, capital absorption. The Avidity acquisition closed in Q1 2026, committing $12 billion in cash to a neuromuscular RNA platform. A second neuroscience acquisition at Stage 1 scale ($55 to $90 billion) in the same calendar year would be structurally unusual, it would roughly double Novartis’s announced M&A commitment for the period and test both balance sheet capacity and internal integration bandwidth. Second, strategic fit specificity. Novartis lacks an established AD franchise equivalent to Kisunla or an AD Phase 3 program equivalent to trontinemab. Their neuroscience strategy is broader (neuromuscular, CNS, kidney-adjacent) and less anchored to the specific AD indication that drives most of ARO-MAPT’s value. Novartis would acquire Arrowhead for the platform, not for ARO-MAPT specifically, which is a valid strategic rationale but a smaller synergy magnitude than either Lilly’s two-franchise fit or Roche’s trontinemab coherence. The Novartis Stage 1 synergy value is $10 to $20 billion, reflecting ARO-SNCA collaboration scaling, broader CNS expertise integration, and RNA therapeutics platform consolidation across Avidity, Regulus, and Arrowhead assets.
Role in the auction.
Novartis is most likely to participate as a serious early-round bidder that forces Lilly and Roche to bid closer to their maximum willingness to pay rather than to settle the asset at a synergy-light price. The insider advantage and the existing ARO-SNCA relationship give Novartis credibility in early bidding rounds; the Avidity capital absorption and lower synergy magnitude make it less likely that Novartis submits the winning final bid. The estimated probability of Novartis winning a competitive auction for Arrowhead in the strong Phase 1 scenario is 10 to 20 percent, with the midpoint lower than the old analysis would have suggested because the Avidity transaction has materially reduced the 2026 neuroscience M&A capital envelope.
Three Motivated Bidders, Three Strategic Cases
The three bidders are motivated by non-overlapping strategic rationales: Lilly by two-franchise fit across AD and obesity, Roche by the unique TfR1 delivery mechanism coherence with trontinemab, Novartis by RNA platform consolidation and the ARO-SNCA platform insider advantage. Each has a path to winning that does not depend on the others’ strategic cases.
The competitive dynamic this produces is the condition that drives auction pricing into the $55 to $90 billion Stage 1 range rather than into a discount-to-standalone outcome. With one motivated bidder, the asset prices at rNPV plus a modest negotiated premium. With three motivated bidders, each of whom has a genuine strategic case and genuine fear of losing to the others, the asset prices at a competitive clearing level that meaningfully exceeds standalone rNPV and approaches the seller’s share of each bidder’s synergy value. Section XI develops the auction mechanics that convert this three-bidder landscape into the $55 to $90 billion final clearing price. Section X develops the synergy math that bounds the range from below (standalone rNPV plus seller’s share of minimum motivated synergy) and from above (the maximum willingness to pay of the highest-synergy bidder, tempered by auction dynamics that prevent the winner from paying their full walk-away price).
Three motivated, capacity-endowed strategic buyers with non-overlapping rationales is structurally rare in pharmaceutical M&A and is itself a driver of the Stage 1 valuation. It is the reason the comparable transactions band in Section V’s Figure 2 clusters above 8× pre-data multiples: those acquisitions also featured multiple motivated strategic bidders, and the final prices reflect competitive pricing dynamics rather than single-bidder negotiations.
Three strategic acquirers, Lilly, Roche, and Novartis, have non-overlapping rationales to compete for Arrowhead. Lilly’s two-franchise fit (Alzheimer’s disease plus obesity) produces total synergy of $45 to $85 billion, materially larger than Roche’s $25 to $40 billion or Novartis’s $10 to $20 billion. Lilly is the highest-probability winner at 50 to 60 percent.
IX. The Licensing Alternative
The scenarios in Section VII identified licensing as the primary outcome path under moderate Phase 1 data; the case where mechanism is validated in humans but efficacy magnitude does not decisively support an acquisition premium. This section develops the licensing path economics and explains why licensing is the equilibrium outcome in the moderate scenario rather than a failure mode. The analysis is subject to the disclaimer in Section VII.
Licensing is not the preferred outcome in the strong Phase 1 scenario. Strong data produces competitive auction dynamics that favor acquisition over licensing for reasons developed below, and strategic bidders will work to convert licensing discussions into acquisition offers when the data supports it. Licensing becomes the equilibrium outcome specifically when acquisition economics do not comfortably exceed the licensing alternative, the condition that materializes under moderate data but not under strong data. Under weak data, neither licensing nor acquisition produces meaningful transactions because the underlying delivery and efficacy thesis has not been validated.
The ARO-SNCA Precedent
On October 20, 2025, Arrowhead announced a licensing agreement with Novartis for ARO-SNCA, their preclinical subcutaneous SNCA-silencing program for Parkinson’s disease and other synucleinopathies. Deal terms: $200 million upfront, up to $2 billion in clinical and regulatory milestones, plus tiered royalties on global net sales. The structure is the appropriate scaling benchmark for an ARO-MAPT licensing transaction because it is recent, involves the same TRiM platform technology, was priced in the current pharmaceutical transaction market, and represents Novartis’s direct valuation of a TfR1-mediated subcutaneous CNS asset.
Two features of the ARO-SNCA deal are particularly relevant. First, the transaction allowed Arrowhead to retain the TRiM platform as its own property and preserved optionality on additional CNS targets. Novartis acquired a specific asset (ARO-SNCA), not the delivery platform. Second, the deal was priced for a preclinical asset with no human data. ARO-SNCA had completed preclinical development and IND-enabling studies, but no Phase 1 had begun at the time of the deal. The $200 million upfront and $2 billion potential milestone value reflect Novartis’s willingness to pay for platform technology validation and for the asset’s preclinical profile, before any human efficacy data existed. An ARO-MAPT licensing transaction following positive Phase 1 data would be priced on substantially stronger evidence.
ARO-MAPT Licensing Economics Post-Phase 1
Figure 11 scales the ARO-SNCA structure for an ARO-MAPT licensing transaction following moderate Phase 1 data. The scaling factors are the stage uplift (Phase 1 data versus preclinical), the AD market multiplier (AD is substantially larger than the synucleinopathy market), and the probability adjustment (moderate Phase 1 data retires delivery risk but leaves cognitive-endpoint risk materially unresolved).
Figure 11: ARO-MAPT Licensing Economics — Post-Phase 1 Moderate Scenario
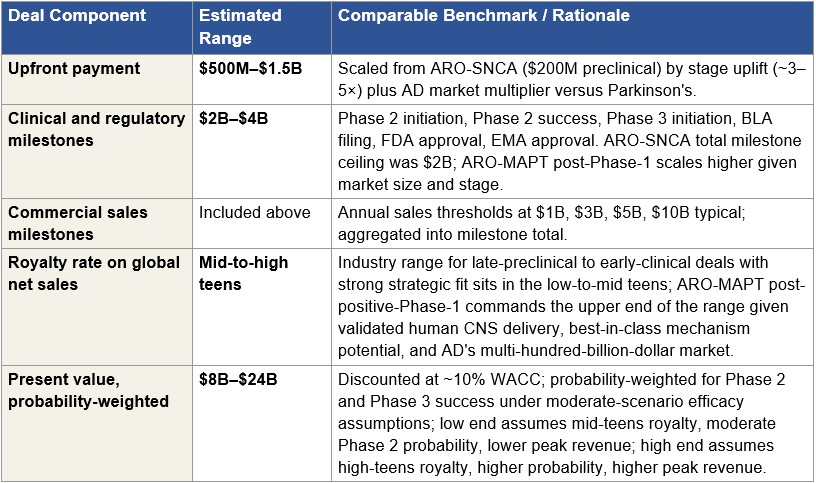
Figure 11: Post-Phase 1 ARO-MAPT licensing economics under the moderate scenario. The $8 to $24 billion probability-weighted present value represents the total expected value to Arrowhead from the licensing transaction, including upfront, milestones, and royalty stream discounted over the asset’s patent life. The range width reflects uncertainty across royalty rate, Phase 2 and Phase 3 success probability, and peak revenue assumptions.
The $8 to $24 billion licensing value is a 3 to 5 times multiple of today’s $9.8 billion market cap from the ARO-MAPT licensing transaction alone, before any value contribution from plozasiran, the extended pipeline, the obesity program, Sarepta partnered streams, or the undisclosed CNS programs. Combined with the public market re-rate to $15 to $25 billion that Section VII describes for the moderate scenario, the total outcome path is a meaningful positive return from today’s entry point rather than a failure mode, even though it is compressed relative to the strong-scenario acquisition outcome.
Why Strategic Acquirers Generally Prefer to Buy Rather Than License
The licensing path is the equilibrium outcome under moderate data specifically because strategic acquirers evaluate licensing and acquisition against each other and, under most data conditions, prefer acquisition. Three structural factors drive this preference.
Control of development pace.
A licensing arrangement requires Arrowhead to execute the Phase 2 and Phase 3 development program. Acquiring Arrowhead gives the acquirer direct operational control of timelines, trial design, protocol amendments, site selection, and commercial launch preparation. For an Alzheimer’s disease program where every quarter of delay has billion-dollar commercial consequences, particularly when competitors including Roche’s trontinemab and Lilly’s own LY-3954068 tau program are advancing in parallel, this control is materially valuable to the acquirer.
Commercial synergy capture.
Under a licensing structure, the acquirer pays Arrowhead a royalty (say mid-teens percent) on global net sales and bears commercial launch cost through its own infrastructure. Under an acquisition structure, the acquirer captures 100 percent of revenue at the marginal cost of deploying their existing infrastructure. For a $40 to $50 billion peak-revenue AD asset, this difference is worth $15 to $25 billion in present value to a commercial-infrastructure-rich acquirer like Lilly. The licensing royalty structure systematically gives away economic value that acquisition preserves.
Platform ownership.
An exclusive license for ARO-MAPT is not a license for the TRiM platform. If the acquirer wants additional CNS programs to complement ARO-MAPT, they would need to negotiate separate deals for each, or face the risk that Arrowhead licenses the next program to a competitor. Acquiring Arrowhead captures the platform as a whole, including the undisclosed pipeline and the platform engine’s capacity to generate additional CNS programs over time. The platform ownership dimension is particularly important for bidders like Roche (which could use TfR1-delivered assets across its broader CNS pipeline) and Novartis (which has already begun platform consolidation through the Avidity and Regulus acquisitions).
Combined, these three factors produce a wedge between what a strategic acquirer would pay to license ARO-MAPT and what they would pay to acquire Arrowhead. For Lilly specifically, the difference is approximately $30 to $60 billion at Stage 1, the gap between the $8 to $24 billion licensing value and the $55 to $90 billion acquisition range, adjusted for the acquirer’s share of the synergy capture. This wedge is what drives strategic acquirers to convert licensing discussions into acquisition offers whenever the data supports an acquisition thesis.
Why Licensing Is the Equilibrium Under Moderate Data
Under strong Phase 1 data, the acquisition wedge dominates: the acquirer’s willingness to pay an acquisition premium comfortably exceeds what they would pay to license the asset, and Arrowhead’s board faces a clear tender offer that exceeds any reasonable calculation of standalone-plus-licensing value. Under weak Phase 1 data, neither transaction is viable. Under moderate data, the economics shift: the acquirer’s willingness to pay an acquisition premium is compressed because the efficacy signal does not support strong-scenario peak revenue assumptions, while the licensing value remains substantially intact because licensing economics survive lower probability assumptions better than acquisition economics do.
The reason is structural. Licensing economics scale primarily with royalty rate and peak revenue; both survive moderate efficacy data reasonably well, with royalty rates potentially compressed slightly and peak revenue compressed moderately. Acquisition economics scale with probability-adjusted expected value plus synergy premium, both of which are more sensitive to efficacy uncertainty because they depend on the buyer’s internal conviction that Phase 2 will succeed. A bidder willing to pay $75 billion for an asset with 22 percent AD probability under strong data is not willing to pay $75 billion for the same asset with 15 percent probability under moderate data; the probability compression compounds through the synergy math. The acquirer’s maximum bid falls faster than the asset’s licensing value does.
For Arrowhead’s board, the moderate-scenario calculation then becomes: accept an acquisition offer that comes in at or below the acquirer’s standalone rNPV plus a modest premium, or license the asset at terms that capture $8 to $24 billion in probability-adjusted deal value while preserving independence, the TRiM platform, and the optionality to transact ARO-MAPT or other platform assets under different terms in the future. The ARO-SNCA decision in October 2025, licensing rather than selling ARO-SNCA or the full platform, is the most recent signal from management that licensing is the preferred mechanism when acquisition economics do not comfortably exceed the licensing alternative. Under moderate data, that condition is the base case.
The Cross-Program Licensing Extension
The ARO-MAPT licensing transaction is not the only licensing opportunity the moderate scenario enables. Arrowhead’s platform supports multiple potential CNS and extrahepatic licensing deals beyond ARO-SNCA and ARO-MAPT. ARO-HTT for Huntington’s disease, ARO-ATXN2 and ARO-ATXN3 for spinocerebellar ataxias, and ARO-FUS for amyotrophic lateral sclerosis are all partnered under the Sarepta collaboration but remain candidates for further licensing or sublicensing structures if Sarepta elects to transact portions of the collaboration portfolio. Undisclosed CNS programs in earlier-stage development could support additional licensing deals over the 2027 to 2030 window. Applied cumulatively across multiple CNS programs, the licensing path could extract $15 to $35 billion in cumulative deal value over the 2027 to 2030 window while preserving Arrowhead’s ownership of the TRiM platform and its standalone operations.
This cross-program extension strengthens the moderate-scenario outcome. Even if ARO-MAPT’s licensing value alone is the $8 to $24 billion range developed above, the platform’s capacity to generate additional licensing deals across the 2027 to 2030 window adds optionality that standalone public-market valuation does not capture. A moderate-scenario Arrowhead that executes ARO-MAPT licensing plus two additional CNS program licenses over 18 to 30 months could approach the lower end of the strong-scenario acquisition range in cumulative deal value terms, without ceding platform ownership.
The Licensing Floor
Licensing provides a floor under shareholder outcomes that does not require an acquisition. If positive Phase 1 data arrives at the moderate level and management pursues licensing rather than acquisition, the stock re-rates based on announced deal values and implied platform economics, and public shareholders retain economic exposure to ARO-MAPT royalty streams plus the remaining platform. The moderate-scenario outcome described in Section VII, public market at $15 to $25 billion plus $8 to $24 billion in licensing deal value, produces a meaningful positive return from today’s $9.8 billion entry point even without the strong-scenario acquisition premium.
The investment thesis is not dependent on the acquisition scenario materializing. The thesis is dependent on positive Phase 1 data at any magnitude that validates the delivery mechanism. Under strong data, the outcome is acquisition at $55 to $90 billion. Under moderate data, the outcome is licensing at $8 to $24 billion plus public market re-rate to $15 to $25 billion. Under weak data, the outcome is bounded by the non-CNS floor. The licensing alternative does not substitute for the acquisition scenario, it supplements it, by providing a positive outcome path under conditions where acquisition economics do not fully develop.
If ARO-MAPT Phase 1 data is moderate rather than strong, a licensing transaction modeled on the ARO-SNCA template extracts $8 to $24 billion in probability-weighted deal value while preserving platform ownership. The moderate scenario is not an acquisition downside; it is a different value-extraction path with materially positive returns from today’s entry.
X. The $55 to $90 Billion Range
Section V introduced the four valuation methodologies pharmaceutical M&A teams use to triangulate acquisition pricing and summarized their convergence at the $55 to $90 billion Stage 1 range. Section VI developed the Monte Carlo enterprise value distribution and confirmed the range sits in the 25th-to-40th percentile of the strong-scenario distribution, which is the band where value-accretive acquisitions clear. Section VIII profiled the three strategic bidders and attributed their distinct synergy magnitudes. This section develops the synergy math in detail and defends the $55 to $90 billion range specifically, both against the alternative that the clearing price should be lower (closer to standalone rNPV) and against the alternative that it should be higher (approaching the maximum willingness to pay of the highest-synergy bidder). The analysis is subject to the disclaimer in Section VII.
The analytical bridge from standalone rNPV to the acquisition range runs through two concepts: the seller’s share of acquirer-specific synergy, and the competitive auction mechanics that bound the clearing price. Standalone rNPV establishes the floor, the value of Arrowhead operating independently, without acquirer infrastructure or strategic fit. Acquirer-specific synergy is the incremental value that an acquirer generates beyond standalone operations: commercial infrastructure integration, defensive protection against competitor acquisition, combination-product pricing power, diagnostic-therapeutic integration, platform consolidation. The seller captures a portion of this synergy in negotiation; the acquirer retains the remainder. The seller’s share is what drives the acquisition range above standalone rNPV. The upper bound, however, is set not by the highest-synergy bidder’s maximum willingness to pay, but by the second-highest bidder’s maximum, because competitive auctions clear at the price required to defeat the second-best bid, not at the winning bidder’s walk-away point.
The Standalone rNPV Floor
Section V established Arrowhead’s standalone rNPV at $45 to $65 billion after a 40 to 50 percent portfolio-level probability haircut. This is the floor beneath any acquisition bid because no bidder would rationally pay less than the value the target could realize independently; the target’s board would reject the bid on fiduciary grounds. For Arrowhead at Stage 1, $45 to $65 billion is the no-synergy baseline. Every dollar above that floor reflects acquirer-specific value that the bidder believes they can generate beyond what Arrowhead can generate standalone. The question Section X answers is: how much of that acquirer-specific value does the seller capture in competitive negotiation, and what does that imply for the clearing price?
The Seller’s Share of Synergy in Competitive Auctions
In corporate M&A, when an acquirer generates synergy value beyond what the target could generate standalone, that synergy is split between buyer and seller in negotiated proportions. The seller’s share varies with the competitive intensity of the auction, the strategic criticality of the asset, the acquirer’s alternatives, and the seller’s walk-away position. In a single-bidder negotiation with a constrained seller, the seller’s share can be as low as 10 to 20 percent. In a competitive auction with multiple motivated bidders and a seller with real alternatives (independent operations, licensing path, walk-away optionality), the seller’s share typically runs 30 to 50 percent.
For Arrowhead at Stage 1, the seller’s share is at the upper end of the typical range because three structural conditions are satisfied. First, three motivated strategic bidders with non-overlapping rationales compete for the asset (per Section VIII), which forces each bidder to price closer to their maximum willingness to pay rather than to the target’s standalone valuation. Second, Arrowhead has a credible walk-away alternative, the licensing path developed in Section IX, which extracts $8 to $24 billion in probability-adjusted deal value without ceding platform ownership. This licensing alternative is real; management executed the ARO-SNCA transaction in October 2025 precisely because it valued platform retention over immediate liquidity. Third, ARO-MAPT in the strong scenario is uniquely positioned as the only validated subcutaneous tau-silencing asset, which means no acquirer can simply walk away and develop a comparable asset internally within a competitive timeframe. The combined effect produces a seller’s share of synergy that sits at 40 to 50 percent, not the 10 to 20 percent a distressed-seller situation would produce.
Bidder Walk-Away Prices
Applying the seller’s share framework to the three bidders produces their walk-away prices, the maximum each bidder could rationally pay while remaining value-accretive. Each walk-away is bidder-specific rNPV plus 50 to 70 percent of bidder-specific synergy. Section VIII developed each bidder’s synergy magnitude and strategic rationale; Figure 12 consolidates the walk-away calculation. The key observation is that Lilly’s walk-away at $73 to $124 billion (midpoint approximately $100 billion) materially exceeds the Stage 1 clearing range, which is set by Roche’s walk-away at $58 to $85 billion. In any auction, the winning bidder pays only enough to defeat the second-highest bidder plus a minimum increment; Lilly retains the remainder of its captured synergy as value accruing to the acquirer. This retained synergy is the economic rationale for Lilly to bid at all, without it, the acquisition would not be value-accretive for Lilly’s shareholders and would not receive board approval.
Figure 12: Bid Capacity by Strategic Bidder
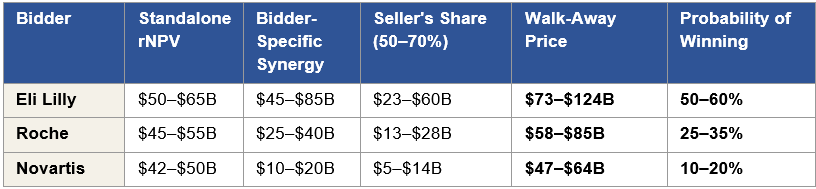
Figure 12: The clearing price of a competitive auction is set by the second-highest walk-away (Roche at $58 to $85 billion) plus a bid increment, not by the highest walk-away (Lilly at $73 to $124 billion). Bid capacity estimates by strategic bidder: Standalone rNPV is the bidder-specific internal rNPV, which differs modestly from the paper’s generic $45 to $65 billion baseline due to bidder-specific discount rate and probability assumptions. Bidder-Specific Synergy is the Section V and VIII estimate. Seller’s Share is 50 to 70 percent of synergy, reflecting competitive auction dynamics. Walk-Away Price is standalone rNPV plus seller’s share of synergy.
How the Competitive Auction Produces the $55 to $90 Billion Range
In auction dynamics, the clearing price is set by the bid required to defeat the second-highest bidder, plus a minimum increment. Lilly wins by bidding just above Roche’s walk-away, not by bidding Lilly’s own maximum. Roche’s walk-away range of $58 to $85 billion therefore establishes the bounds of the clearing price, with $55 to $90 billion brackets reflecting the structural uncertainty around each bound.
The lower bound ($55 billion) is anchored by multiple independent inputs converging at approximately the same level. Standalone rNPV is $45 to $65 billion; even the smallest motivated synergy (Novartis at $10 to $20 billion, seller’s share at 40 to 50 percent) contributes $4 to $10 billion to a minimum-seller-share clearing price, producing a floor near $50 billion from the fundamentals-based arithmetic. Comparable pre-data transaction multiples (Prometheus 10.8×, MyoKardia 6.5×, Karuna 9.3×, ImmunoGen 12.6×) anchor the minimum pre-data multiple at 5.6×, which applied to Arrowhead’s $9.8 billion market cap produces $55 billion. The confluence of these independent anchors at $55 billion is why the paper holds that number as the lower bound rather than defaulting to the rNPV floor alone.
The upper bound ($90 billion) is set by Roche’s maximum walk-away plus the strategic premium Lilly pays to secure the asset in a contested three-way auction. In a competitive environment where the highest-synergy bidder (Lilly) recognizes that losing to Roche has long-term strategic cost, the Kisunla defensive damage Section VIII quantified, Lilly’s rational bid extends above the second bidder’s exact walk-away to ensure the transaction closes. The upper bound therefore sits at $90 billion rather than at Roche’s $85 billion walk-away, reflecting the contested-auction premium a high-synergy bidder will pay for certainty of execution.
Methodology Convergence at $55 to $90 Billion
The $55 to $90 billion range is not the output of a single methodology. It is the convergence point across the four independent methodologies introduced in Section V, each of which produces ranges consistent with the paper’s conclusion through different analytical mechanisms.
The rNPV standalone baseline ($45 to $65 billion) sits just below the acquisition range, with the gap representing the seller’s share of synergy ($10 to $25 billion) captured through competitive auction dynamics. The peak revenue multiple methodology ($72 to $120 billion) fully contains the acquisition range, reflecting the historical pattern that validated-mechanism platform assets transact at 4 to 6 times risk-adjusted peak revenue. The Monte Carlo median ($75 to $105 billion) sits slightly above the acquisition range, with the $55 to $90 billion range corresponding to the 25th to 40th percentile of the Strong scenario distribution, the band where value-accretive acquisition pricing occurs because the probability of overpayment is bounded below 40 percent. The comparable transactions methodology ($55 to $90 billion), anchored to pre-data multiples from Prometheus (10.8×), MyoKardia (6.5×), Karuna (9.3×), and ImmunoGen (12.6×), is exactly the paper’s conclusion, reflecting that the comparable transactions framework is the most directly evidence-anchored of the four methods and the one M&A teams lean on most heavily when defending a bid to their boards.
The convergence is analytically meaningful because the four methodologies share no common inputs. rNPV starts from peak revenue forecasts and discount rates. Peak revenue multiples start from historical acquisition ratios. Monte Carlo starts from probability distributions across nine input variables. Comparable transactions start from closed-deal premia. When four independent analytical frameworks with different theoretical foundations produce overlapping ranges, the conclusion is not the artifact of any one methodology’s assumptions, it is the structural answer to the valuation question. The $55 to $90 billion range is where all four methodologies agree, which is the analytical condition for high-confidence valuation conclusions in pharmaceutical M&A.
The Analytical Consensus
The $55 to $90 billion Stage 1 acquisition range is the analytical consensus across independent valuation methodologies, constrained by competitive auction mechanics, and consistent with bidder-specific walk-away prices. It is not the maximum Lilly could pay, nor is it the minimum Arrowhead’s board would accept. It is the price at which the second-highest bidder (Roche) is forced out of the auction, which is the point where competitive auctions clear in practice.
The range has bounds rather than a point estimate because each input has plausible uncertainty: bidder-specific rNPVs, synergy magnitudes, seller’s share, and bid increments all vary within defensible assumptions. The $55 to $90 billion range is the window within which a competitive Stage 1 auction for Arrowhead would clear under the strong Phase 1 scenario, with the specific clearing price determined by the resolution of these input uncertainties at the time of transaction.
Figure 13: Valuation Range Chart
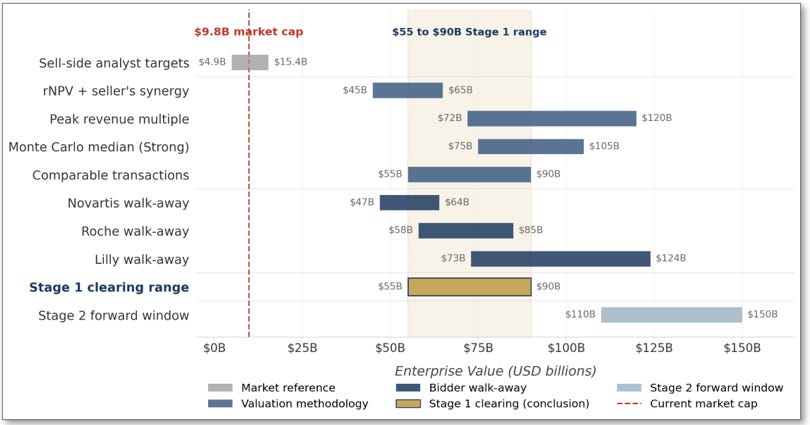
Figure 13: Valuation range chart summarizing the paper’s valuation framework. Each horizontal bar shows the range produced by one input to the Stage 1 valuation question. The shaded $55 to $90 billion gold zone marks the paper’s conclusion, the Stage 1 clearing range.
Sections XI, XII, and XIII develop the remaining analytical work: Section XI describes the auction mechanics in operational detail (who engages whom, on what timeline, through what process); Section XII develops additional supporting evidence beyond the core valuation framework; Section XIII addresses the strongest counter-arguments to the thesis. The $55 to $90 billion range developed in this section is the analytical anchor those sections reference.
The $55 to $90 billion Stage 1 range is set by Roche’s walk-away price (the second-highest bidder), not by Lilly’s maximum. The lower bound is anchored by three independent methodologies converging at $55 billion. The thesis does not depend on the upper end of the range to produce a transformative return.
XI. The Stage 1 Auction
Section X developed the valuation math that produces the $55 to $90 billion Stage 1 acquisition range. This section describes the operational mechanics of how that range is realized in practice: the formal process trigger, the bidding rounds, the specific role of each bidder at each round, and the structural progression that produces the final clearing price. The auction described here is subject to the disclaimer in Section VII: the round-by-round bid trajectories are analytical hypotheticals constructed from publicly available information about pharmaceutical M&A practice and from the bidder walk-away prices developed in Section X, not predictions of actual bidding behavior or any current strategic process.
Large pharmaceutical M&A auctions are managed processes, not public tenders. They are typically run by investment banking advisors engaged by the target’s board, with sequential rounds of informal outreach, management presentations, due diligence access, and final-round sealed bids. The process from announcement of a strategic review to signing of a definitive agreement typically takes three to six months; from signing to close adds another three to nine months for regulatory clearance and shareholder approval. The total timeline from Phase 1 readout to close under the strong scenario is approximately 6 to 18 months, consistent with the Section VII strong-scenario narrative.
The Formal Process Trigger
The Arrowhead auction process begins at one of three moments following positive Phase 1 data. First, Arrowhead’s board could proactively initiate a strategic review process immediately after the readout, engaging investment bankers to run a formal sale process. This is the most likely path when the data is sufficiently strong to attract multiple serious bidders and management recognizes that public market re-rating alone will not capture the full value accessible through strategic acquisition. Second, an unsolicited approach from a bidder, most plausibly Lilly given their two-franchise strategic urgency, could trigger a formal process under the board’s fiduciary duty to evaluate all alternatives. Third, a bidding contest could develop organically if multiple parties approach Arrowhead simultaneously after the data publication, forcing the board to conduct a formal process to discharge its fiduciary obligations to shareholders.
In any of these scenarios, once positive ARO-MAPT data is public and multiple strategic acquirers are known to be evaluating the company, the board has a legal obligation to conduct a fair process. The mechanics from that point forward are standard: bankers issue confidentiality agreements, manage the data room, schedule management presentations, structure the bidding rounds, and run the final-round sealed bid process. The competitive dynamic described in the next subsections emerges naturally from this managed process rather than requiring any specific bidder behavior to trigger it.
The Pre-Auction Phase
Within the first 72 hours of the Phase 1 readout, informal outreach from potential acquirers begins. The initial contacts are typically by bankers, not company executives, standard pre-transactional practice that preserves optionality without creating disclosure obligations. By the end of the first post-readout month, the three potential bidders profiled in Section VIII (Lilly, Roche, and Novartis) have each engaged their internal M&A teams to perform independent valuation work using the frameworks from Sections V and X. By months two to four, at least two of the three bidders have signed confidentiality agreements with Arrowhead and gained access to a data room containing the clinical, regulatory, manufacturing, financial, and partnership documentation needed for formal diligence.
During this pre-auction period, the Arrowhead board engages its own advisors, typically the major pharmaceutical M&A specialists at firms such as Centerview, Goldman Sachs, and Morgan Stanley. These advisors construct the process: who is invited to bid, what information is disclosed at each round, the timeline for each phase, and the structure of the final round. The CEO and board weigh the strategic options during this period: remain independent and pursue licensing (per Section IX), license ARO-MAPT specifically while retaining the platform, or sell the company. With multiple bidders engaged and public market pressure building for liquidity realization at strong-scenario valuations, the path of least resistance in the strong scenario is a formal sale process.
The Bidding Rounds
The bidding process typically runs three rounds over approximately three to five months. Round 1 is the opening round following initial diligence access, where bidders signal interest and establish starting positions below their internal walk-away prices. Round 2 is the serious round following management presentations and deeper technical diligence, where bidders reprice based on their updated internal models. Round 3 is the final auction, typically a sealed-bid process among the two or three most serious remaining bidders. Figure 14 summarizes the expected bid trajectory by bidder across the three rounds, calibrated to the Section X walk-away prices.
Figure 14: Expected Bid Progression by Round
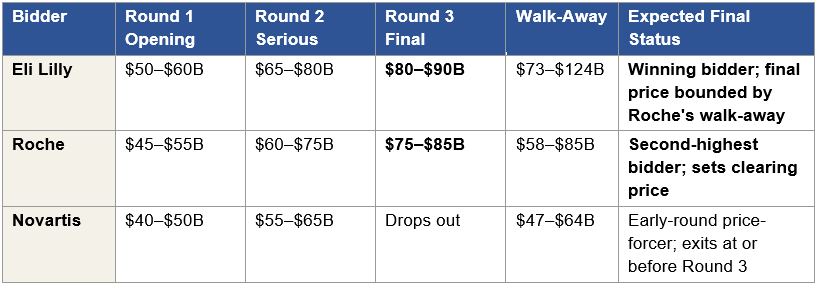
Figure 14: Expected bid progression across three rounds. Round 1 openings are disciplined starting bids below each bidder’s walk-away, designed to signal serious intent without revealing the ceiling. Round 2 bids reflect full diligence and the bidder’s updated internal valuation. Round 3 is the final auction among remaining bidders, with Lilly winning at $80 to $90 billion, above Roche’s final bid but well below Lilly’s $124 billion theoretical maximum. Novartis drops out in Round 2 or Round 3 as the bidding approaches their $47 to $64 billion walk-away range. The final clearing price sits within the $55 to $90 billion Stage 1 range developed in Section X.
Round 1: Opening Bids
Round 1 bids are disciplined openings. Each bidder has completed initial diligence but not yet conducted the deep management presentations and technical sessions that follow. The opening bids are designed to signal serious intent and meet the participation threshold set by the Arrowhead advisors without revealing the bidder’s full internal valuation. Lilly opens at $50 to $60 billion, a strong opening bid that pre-empts lower bids from competitors and demonstrates two-franchise strategic conviction. Roche opens at $45 to $55 billion, a disciplined opening that reserves capacity for later rounds while signaling engagement. Novartis opens at $40 to $50 billion, possibly accompanied by a request for right-of-first-refusal treatment given the existing ARO-SNCA partnership relationship.
The Round 1 bids cluster below each bidder’s walk-away because opening at the walk-away leaves no room to respond to competitive pressure in subsequent rounds. A bidder who opens at their maximum signals they have no additional capacity, which weakens their position in the negotiation. Each bidder’s Round 1 bid is also shaped by information asymmetry: Lilly has the most to lose defensively if they underbid and a competitor wins, which motivates their higher opening; Roche has unique synergy that the other bidders do not know about in detail, which allows them to bid with discipline knowing Round 2 and Round 3 remain available; Novartis has the narrowest synergy and is most price-sensitive, which explains their lower opening.
Round 2: The Serious Round
By Round 2, the bidders have conducted management presentations and deeper technical diligence on the clinical, manufacturing, commercial, and partnership dimensions of the company. Each bidder’s internal valuation has updated with information that was unavailable at Round 1, and the bids reprice accordingly. Lilly moves to $65 to $80 billion as they now incorporate the full AD franchise defensive damage calculation and the obesity program Phase 1/2a data into their internal model. Roche bids $60 to $75 billion as they finalize the trontinemab delivery mechanism synergy and the Elecsys diagnostic integration. Novartis bids $55 to $65 billion, having confirmed platform technical fit but recognizing that their synergy magnitude does not support bidding at the levels Lilly and Roche are reaching.
Round 2 is the round where Novartis’s role in the auction becomes visible. Their $55 to $65 billion bid sits at or slightly above their $47 to $64 billion walk-away, which means they cannot meaningfully raise in Round 3 without paying above their maximum willingness to pay. Novartis’s strategic value in the auction at this point is as a price-forcer that has compelled Lilly and Roche to bid closer to their higher walk-aways, not as a likely final winner. The probability distribution from Section VIII, Novartis at 10 to 20 percent, reflects the small but non-zero chance that Lilly and Roche both bid conservatively and Novartis wins at a price within their walk-away range.
Round 3: The Final Auction
Round 3 is typically a sealed-bid process run by Arrowhead’s advisors, in which the remaining bidders submit final bids simultaneously with no opportunity for further iteration. The bidders remaining in Round 3 are most likely Lilly and Roche; Novartis has either dropped out after Round 2 or submitted a Round 3 bid below the competitive threshold. Roche’s final bid is in the $75 to $85 billion range, at or near the upper end of their $58 to $85 billion walk-away. Lilly’s final bid is $80 to $90 billion, above Roche’s bid but well below Lilly’s own $73 to $124 billion walk-away — just high enough to win while preserving meaningful synergy capture for Lilly’s shareholders.
Lilly wins Round 3 at $80 to $90 billion. The competitive premium Lilly pays above Roche’s bid reflects the contested-auction dynamic developed in Section X; Lilly pays above the second-highest bidder’s walk-away to secure the asset and prevent the strategically devastating outcome of Roche owning a tau-silencing asset positioned against Kisunla. The final price is not what ARO-MAPT is worth to Lilly in isolation, it is the price at which Lilly defeats Roche by a sufficient margin to close the transaction.
The Clearing Outcome
The $80 to $90 billion Round 3 clearing price sits at the upper end of the $55 to $90 billion Stage 1 range developed in Section X. The Section X range reflects structural uncertainty around multiple inputs; the seller’s share of synergy could be 40 to 50 percent instead of 50 to 70 percent, Roche’s walk-away could be at the low end of $58 billion rather than the high end of $85 billion, Novartis could exit earlier than expected and reduce competitive pressure on Lilly, each of which would shift the clearing price downward within the range. Under the base case where the three bidders behave as Figure 14 describes and Section X’s walk-away estimates hold, the clearing lands in the $80 to $90 billion band. Under less favorable auction dynamics, the clearing could land as low as $55 billion; under more favorable dynamics or if Lilly pushes toward the upper end of their capacity, the clearing could touch $90 billion. The $55 to $90 billion range therefore brackets the plausible outcomes.
The per-share implication at the $80 to $90 billion base case is approximately $517 to $581 per fully diluted share (using 155 million diluted shares for the acquisition scenario), which is 7.4 to 8.3 times today’s $70 per share. The per-share range across the full Stage 1 band of $55 to $90 billion is $355 to $581, or 5.1 to 8.3 times today’s entry. Public shareholders receive this premium as consideration in the acquisition, typically in cash or a cash-and-stock mix depending on the acquirer’s transaction structure preferences.
Board Dynamics and Closing
The Arrowhead board evaluates the Round 3 bids against the fairness opinions from their advisors, the comparable transactions analysis, the standalone plan with licensing optionality (per Section IX), and the relative risk of accepting versus rejecting the winning bid. A bid in the $80 to $90 billion range substantially exceeds the standalone-plus-licensing value developed in Section IX ($15 to $25 billion public market re-rate plus $8 to $24 billion licensing deal value, under moderate scenarios) and exceeds the strong-scenario public market re-rate from Section I ($25 to $45 billion). The fiduciary calculation is straightforward under these conditions: the winning bid delivers shareholder value that Arrowhead cannot credibly generate independently on any reasonable timeline, and the board accepts.
The definitive agreement is typically signed within two to four weeks of Round 3 bid submission, following final negotiation on non-price terms (break-up fees, representations and warranties, regulatory closing conditions, employee retention structures). Announcement occurs at signing. Hart-Scott-Rodino antitrust clearance and shareholder approval proceed in parallel over the following three to nine months. The transaction closes approximately 6 to 18 months after the original Phase 1 readout. The investor who entered at today’s $9.8 billion market cap realizes their return at close, typically in cash, which is immediately reinvestable.
Sections XII and XIII develop the remaining analytical work: Section XII adds supporting evidence beyond the core valuation and auction framework developed in Sections V through XI, and Section XIII addresses the strongest counter-arguments to the thesis.
The Stage 1 auction runs standard pharmaceutical M&A mechanics: three rounds over three to five months, with Lilly winning Round 3 at $80 to $90 billion above Roche’s final bid of $75 to $85 billion. The clearing price is not what ARO-MAPT is worth to Lilly in isolation, it is the price at which Lilly defeats Roche by a sufficient margin to close the transaction.
XII. Additional Evidence
Sections I through XI developed the core thesis: three Phase 1 scenarios, four valuation methodologies, three strategic bidders, auction mechanics producing a $55 to $90 billion clearing range. This section adds three pieces of supporting evidence that reinforce the core argument but do not fit neatly within any single prior section. Each is concrete, recent, and specific to Arrowhead. Taken together, these supporting pieces reinforce the conclusion that Arrowhead at today’s $9.8 billion market cap is systematically mispriced relative to what an acquirer’s internal valuation produces under the strong Phase 1 scenario.
Alnylam’s 2025 Annual Report: The Competitor Capability Gap
Alnylam Pharmaceuticals is the most resourced siRNA company in the world: $2.99 billion in 2025 revenue, $42 billion market cap, and a validated commercial platform across liver, muscle, and CNS. In the 2025 Annual Report published April 2026, Alnylam disclosed its Alnylam 2030 strategic plan for the next five years. The CNS pipeline in that plan consists of five intrathecal programs delivered via lumbar puncture. Zero subcutaneous blood-brain-barrier-crossing programs. If the most capable siRNA company in the world had a credible path to subcutaneous CNS delivery on a competitive timeline, it would be in the strategic plan. It is not. Arrowhead has built something its largest competitor has not.
This is the strongest publicly available third-party validation of Arrowhead’s delivery platform. It is not an analyst opinion; it is a five-year capital-allocation plan published by the competitor best positioned to replicate the capability. When ARO-MAPT produces positive Phase 1 human data, the implication is structural: Arrowhead owns a delivery mechanism that the best-funded alternative in the field has not matched. That scarcity is the foundation of the strategic premium an acquirer pays above standalone rNPV.
Gene X: The Platform Engine’s Hidden Output
On December 10, 2025, at the 7th Annual CNS Delivery Summit, Arrowhead presented non-human primate data showing approximately 90 percent mRNA knockdown across all brain regions for a target they refused to name. The slide title identified the target only as “Gene X” and described the indication only as “cardiometabolic.” This disclosure is concrete evidence for a claim that otherwise depends on inference, that the platform engine generates programs at a pace and with performance characteristics that sell-side models cannot capture because the sell-side cannot model programs the company has not disclosed.
Several details make this disclosure unusually informative. First, the 90 percent knockdown efficacy is higher than what Arrowhead has publicly disclosed for any named CNS program, including ARO-MAPT (70 to 80 percent in deep brain regions), ARO-HTT, ARO-SNCA, or ARO-ATXN3. Arrowhead’s best publicly disclosed CNS knockdown data is for a target they have not named. Second, the audience at the CNS Delivery Summit was the business development and research teams of every major pharmaceutical company with a neuroscience or metabolic program. The disclosure was deliberately positioned to the exact decision-makers who would price platform value in a strategic evaluation. Third, the target is described as cardiometabolic, which is distinct from any of Arrowhead’s named CNS programs. This is a CNS-delivered therapeutic for a non-CNS disease area, an entirely new category of RNAi application, and one that no competitor has demonstrated.
The strategic message embedded in the Gene X disclosure is that the platform is not a single-asset story. The delivery mechanism works for multiple gene targets at exceptional potency, programs exist in development that have not been named, and the pace of pipeline generation exceeds what disclosed programs alone imply. An acquirer pricing platform optionality after seeing the Gene X slide is not speculating about future programs. They are pricing a confirmed capability with a concealed pipeline behind it. This is the kind of evidence that moves the platform optionality input in the Monte Carlo (Section VI) from speculative to evidenced, and it is one of the reasons the M&A team’s rNPV (Section V) diverges materially from sell-side consensus.
Manufacturing Infrastructure as Strategic Currency
Arrowhead’s Verona, Wisconsin manufacturing facility provides three operational GMP production lines currently producing clinical and commercial supply across the TRiM platform. In the standalone valuation, Verona shows up as a cost center on the balance sheet. In an acquirer’s internal valuation, Verona shows up as pre-positioned manufacturing capacity that an acquirer can deploy on day one of ownership; strategic currency that is immediately usable rather than infrastructure the acquirer must build from scratch.
The strategic value of Verona has three components. First, replacement cost. A comparable three-line GMP facility capable of TRiM chemistry production at commercial scale costs approximately $2 to $4 billion to construct, and the construction and qualification timeline is five to seven years. An acquirer that does not own Verona faces this cost and delay; an acquirer that acquires Arrowhead inherits the facility fully operational. Second, the adjacent parcel option. Arrowhead holds an option through 2028 to acquire 6.24 adjacent acres, on which expansion facilities can be constructed. The cost advantage of expansion on the adjacent parcel versus greenfield construction at a new site is approximately 40 to 60 percent, driven by shared utilities, shared permits, shared environmental qualification, and partially reusable design work. The time advantage is 18 to 24 months, driven by the elimination of site selection, initial permitting, and base regulatory qualification phases. For an acquirer planning to scale TRiM manufacturing across multiple commercial products over the next decade, this expansion pathway represents a specific economic asset worth an incremental $1 to $2 billion in avoided cost and accelerated time-to-capacity. Third, TRiM chemistry expertise. The operational know-how embedded in Arrowhead’s manufacturing staff, developed over fifteen years of platform work, is not purchasable off the shelf. An acquirer that buys the asset also buys the people who know how to make it at scale.
Taken together, the Verona infrastructure represents $3 to $6 billion in strategic currency to an acquirer, larger than the nominal book value of the facility by a factor of five to ten. This is a specific line item in an acquirer’s internal model and is entirely absent from sell-side rNPV, which treats manufacturing capacity as an implicit assumption rather than a valued asset.
The Long-Horizon Platform Value
The Stage 1 acquisition range of $55 to $90 billion answers a specific analytical question: what is Arrowhead worth to a strategic acquirer if ARO-MAPT produces positive Phase 1 data in 2H2026? It does not answer the broader question an acquirer’s board also asks: what does this platform look like on our income statement ten years from now? The answer to that broader question is why a strategic acquirer pays the Stage 1 premium in the first place, and it is the reason Stage 1 transactions of this kind are value-accretive even at prices that look aggressive at the moment of signing.
By 2036, the plozasiran cardiovascular franchise is at or approaching commercial peak, generating $15 to $30 billion annually across FCS, sHTG, and CAPITAN mixed hyperlipidemia indications (if CAPITAN reads out positive). ARO-MAPT in Alzheimer’s disease is in commercial ramp following expected 2035 launch, with the subcutaneous quarterly profile removing structural barriers that have constrained first-generation anti-amyloid uptake; early commercial revenues of $5 to $15 billion growing steeply. The obesity program, if validated in pivotal trials, is generating meaningful revenue through a differentiated non-GLP-1 mechanism. The Sarepta and Novartis partnered programs are producing milestone and royalty streams as their own clinical programs advance. The broader platform, Gene X, ocular TRiM, cardiac TRiM, and programs not yet named, is beginning to produce additional clinical-stage candidates at the pace the platform engine has demonstrated over the prior five years.
The total Arrowhead-derived revenue to an acquirer in 2036 is estimated at $45 to $85 billion annually, representing a material fraction of a major pharma acquirer’s total revenue base at that horizon. At the upper end of that range, Arrowhead-derived revenue could approach 15 to 20 percent of Lilly’s projected 2036 revenue, which is the order-of-magnitude contribution that justifies a $55 to $90 billion Stage 1 acquisition price even on purely financial grounds. The Genentech precedent referenced in Section II is the closest historical parallel: Roche paid $46.8 billion in 2009 for a remaining Genentech stake that analysts at the time characterized as expensive, and the platform subsequently generated hundreds of billions of dollars of cumulative revenue under Roche ownership across Herceptin, Rituxan, Avastin, Perjeta, Kadcyla, and subsequent programs. The Stage 1 Arrowhead acquisition is the same structural argument applied to a different platform technology at a different inflection point.
How These Pieces Reinforce the Core Thesis
The Gene X disclosure demonstrates that the platform’s output exceeds sell-side visibility; programs exist that no public model captures. The Verona infrastructure demonstrates that the company owns strategic currency that standalone valuation does not value; an acquirer inherits an operational manufacturing asset worth several billion dollars more than its book value. The long-horizon platform analysis demonstrates that Stage 1 acquisition economics are not driven by the immediate ARO-MAPT contribution alone, they are driven by a decade of platform revenue generation that justifies paying above standalone rNPV at signing.
None of these three pieces is necessary for the core thesis; the core thesis stands on the four valuation methodologies and the auction mechanics developed in Sections V through XI. But each reinforces the conclusion by adding specific evidence where the core framework uses inference. An investor evaluating whether the core thesis is robust can look to Gene X for evidence that the platform engine is real, to Verona for evidence that the manufacturing infrastructure is real, and to the long-horizon analysis for evidence that the Stage 1 premium is not aggressive when viewed against the ten-year revenue base an acquirer captures through ownership.
Gene X demonstrates the platform engine produces programs the sell-side cannot model. Verona represents $3 to $6 billion of strategic currency absent from rNPV. The 2036 long-horizon projects $45 to $85 billion of annual Arrowhead-derived revenue to an acquirer, the Genentech precedent applied to a different platform at a different inflection point.
XIII. Critic’s Brief
The thesis developed across Sections I through XII depends on a chain of analytical assumptions that are defensible but not beyond reasonable objection. This section addresses five specific objections, the strongest a sophisticated institutional skeptic would raise, and explains what each correctly identifies and why the thesis still holds. The objections are presented in their strongest form, not as strawmen.
Objection 1: The Magnitude of the Acquisition Range
The most fundamental objection to the thesis is the most basic one: no acquirer would pay $55 to $90 billion for a company whose lead asset has not yet completed Phase 1 and whose total revenue base is a fraction of the acquisition price. Base rates in pharmaceutical M&A run against this magnitude of outcome. The modal biotech acquisition premium over unaffected market cap is 30 to 50 percent, not the 460 to 820 percent the thesis implies relative to today’s $9.8 billion market cap. Pharmaceutical acquisitions above $50 billion are extraordinarily rare, and the handful that have cleared that threshold over the past twenty-five years were all for companies with substantial commercial revenue, none for a primarily clinical-stage biotech with a single lead asset awaiting Phase 1 data. The four comparables anchoring the paper’s 5.6× to 9.2× pre-data multiple all transacted from pre-data market capitalizations five to ten times smaller than Arrowhead’s $9.8 billion. Larger targets typically transact at compressed multiples. A board approving $85 billion for Arrowhead at Stage 1 would face shareholder litigation, proxy challenges, and structural political-economy resistance. And Arrowhead’s management has spent fifteen years building the company as an independent platform operator, with licensing agreements rather than sales, and no sell-side bankers engaged.
The objection correctly identifies multiple real patterns. Base rates are against extreme-magnitude outcomes; they are extreme by definition. Pharmaceutical acquisitions above $50 billion are historically rare and involve substantial commercial revenue that Arrowhead does not yet have. Larger targets transact at compressed multiples. Board political-economy constraints make extraordinary transactions structurally harder to approve than ordinary ones. Management positioning matters; Arrowhead’s leadership has demonstrated a clear preference for independence and licensing over acquisition. These observations are accurate, and the thesis does not deny them. The analytical question is whether Arrowhead’s specific structural characteristics place it in the tail of the distribution these base rates describe, or whether it belongs in the modal band.
The argument that Arrowhead is in the tail rests on three specific structural conditions that the modal biotech acquisition does not share. First, subcutaneous TfR1-mediated CNS delivery is unique. No competitor has replicated it, and no competitor can develop a comparable asset on a competitive timeframe, so an acquirer that wants this platform does not have an alternative target. Second, three motivated strategic bidders with non-overlapping rationales compete for the asset, a structural condition that is rare in pharmaceutical M&A and that specifically drives clearing prices above single-bidder negotiation outcomes. Third, the Lilly two-franchise fit (AD plus obesity) is distinctive; no other bidder has equivalent strategic exposure across two therapeutic areas where Arrowhead’s pipeline creates value. The relevant size precedent for this combination of conditions is Genentech ($46.8 billion in 2009), a platform acquisition where the acquirer was paying for the engine, not just current output, and which subsequently generated hundreds of billions of dollars of cumulative revenue under Roche ownership. Platform acquisitions at this scale are rare because the structural conditions that justify them are rare, not because the economics are irrational when those conditions hold.
The board and management objections cut differently than the skeptic frames them. Boards face scrutiny for paying extraordinary premiums; they also face scrutiny for missing transformational acquisitions that competitors capture. Lilly’s board declining to acquire Arrowhead while Roche acquires Arrowhead, and then watching Roche-owned ARO-MAPT pressure Kisunla over a decade, faces more severe political-economy consequences than paying $85 billion to secure the asset. The defensive calculation fundamentally changes the board’s risk-reward structure. On management positioning, fifteen years of platform-independence strategy is context, not destiny. The relevant question is not whether management prefers independence under ordinary conditions, but whether the board’s fiduciary obligation compels a sale when a strategic acquirer offers valuation that shareholders cannot credibly match through independent operations plus licensing. Under the strong Phase 1 scenario, an $85 billion offer against standalone-plus-licensing value of $25 to $45 billion is very difficult to decline. Management preference does not override fiduciary duty.
Objection 2: Acquirers May Rationally Wait for Phase 2 Cognitive Data
The thesis assumes acquirers move at Stage 1 following positive Phase 1 data. But Phase 1 data in 2H2026 resolves delivery risk and biomarker pharmacology, it does not resolve the cognitive endpoint question that ultimately determines whether ARO-MAPT reaches approval. BIIB080’s CELIA Phase 2 cognitive data is pending. A rational acquirer could decide that the cost of waiting for Phase 2 data in 2029-2030 is lower than the cost of paying a Stage 1 premium without cognitive confirmation. If Lilly waits, the auction doesn’t develop at Stage 1. Arrowhead remains public, re-rates on Phase 1 data to $25 to $45 billion, and the strong-scenario acquisition range is not realized on the thesis timeline.
This objection points to a real strategic decision each bidder faces. It is rational for a bidder to wait if the expected cost of waiting is lower than the Stage 1 premium. But the expected cost of waiting is not simply the Stage 2 acquisition premium minus the Stage 1 acquisition premium. It includes two additional components: the probability that a competitor acquires Arrowhead at Stage 1 (permanent loss of the asset, plus defensive damage), and the re-rating of Arrowhead’s public market cap between Stage 1 and Stage 2 (which compounds the Stage 2 entry price). The Stage 1 entry captures a specific competitive advantage that Stage 2 entry does not: preventing a rival from owning the asset during the Phase 2 development window.
For Lilly specifically, the defensive component dominates. If Roche acquires Arrowhead at Stage 1 and Roche-owned ARO-MAPT reaches Phase 2 cognitive readout in 2029-2030 as part of a Roche-developed program, Lilly faces a Kisunla franchise competitive threat that Lilly cannot respond to with internal development on any reasonable timeline. The Stage 1 acquisition for Lilly is therefore not primarily a decision about ARO-MAPT’s probability-adjusted expected value, it is a decision about defensive optionality. This is the specific reason Section VIII attributes a 50 to 60 percent probability to Lilly winning a Stage 1 auction: the defensive calculation produces a bid capacity above what a waiting-for-Phase-2 strategy would allow.
Objection 3: The Three-Bidder Competitive Auction May Not Develop
The $55 to $90 billion clearing range depends on at least two motivated bidders competing. If only Lilly bids seriously, the clearing price lands much closer to Arrowhead’s standalone rNPV than to the $55 to $90 billion range. Lilly can negotiate a transaction at $30 to $50 billion because there is no competitive pressure forcing the price higher. The objection challenges the structural assumption that Roche and Novartis bid aggressively. Roche may decline to bid given trontinemab is their AD priority and ARO-MAPT is a complement rather than a substitute. Novartis may decline given the $12 billion Avidity acquisition absorbed their 2026 neuroscience M&A capital. If both decline to bid aggressively, the auction does not produce the clearing dynamics Section XI describes.
Each bidder does have plausible reasons to decline aggressive bidding, and the paper does not claim the competitive auction is guaranteed, but three observations bound the downside. First, even a single-bidder Lilly negotiation produces an acquisition price well above today’s $9.8 billion market cap. A Lilly-only bid at standalone rNPV plus a modest premium would still produce $50 to $70 billion, a 5× to 7× return from today. Second, Roche’s strategic calculus specifically supports bidding even if trontinemab is their AD priority: if Lilly acquires Arrowhead and combines Kisunla with ARO-MAPT, Roche faces a Lilly-owned two-mechanism AD franchise that competes directly against trontinemab. Defensive value for Roche is real; they cannot credibly decline to bid while trontinemab is in Phase 3. Third, even if Novartis declines, a two-bidder auction between Lilly and Roche still produces competitive clearing dynamics, just with a lower second-highest walk-away anchor that produces clearing in the lower half of the range ($55 to $70 billion) rather than the upper half. That is still a significant return from today’s entry.
Objection 4: The Synergy Estimates Are Aggressive
The Lilly synergy total of $45 to $85 billion is the single largest input into the Stage 1 clearing range. A substantial portion of that synergy ($30 to $50 billion) is attributed to the AD franchise, anchored on $15 to $25 billion in Kisunla defensive value. The objection is that Kisunla is already facing competitive pressure from Leqembi, trontinemab, and potentially future anti-amyloid entrants. The incremental defensive damage attributable specifically to competitor ownership of a subcutaneous tau-silencing asset, as opposed to the damage Kisunla faces from existing competitors regardless, may be smaller than $15 to $25 billion. The two-mechanism franchise pricing power ($10 to $15 billion) similarly assumes combination regimens command 25 to 40 percent pricing premiums, which is a range observed in oncology and immunology but not yet tested in AD where pricing dynamics remain in early stages of establishment.
Specific dollar values do carry uncertainty, but the synergy estimates are ranges, not point estimates, and the paper’s competitive clearing analysis in Section X already absorbs significant input uncertainty without breaking the conclusion. The Lilly walk-away calculation uses 50 to 70 percent seller’s share of synergy, which already discounts the raw synergy totals. A 30 percent reduction in Lilly’s AD synergy estimate (from $30-$50B to $21-$35B) produces a Lilly walk-away of approximately $60 to $95 billion rather than $73 to $124 billion, which still exceeds the Stage 1 clearing range. The second-highest bidder (Roche) sets the clearing price, not Lilly’s maximum, so compression in Lilly’s synergy does not directly compress the clearing range.
The more consequential test for the thesis is whether Roche’s synergy estimate ($25 to $40 billion) survives compression. Roche’s synergy is anchored on three components that are less speculative than Lilly’s defensive calculations: trontinemab TfR1 delivery mechanism coherence (a scientific observation, not a competitive estimate), Elecsys diagnostic-therapeutic integration (an existing commercial infrastructure, not a projection), and comprehensive AD portfolio integration (an assemblage of existing assets, not contingent on new development). A reasonable downside on Roche’s synergy might compress it to $18 to $30 billion, which produces a Roche walk-away of $54 to $75 billion, still within the Stage 1 clearing range. The thesis does not depend on the upper end of the synergy estimates; it depends on the minimum-motivated-bidder synergy being large enough to produce a competitive clearing price meaningfully above standalone rNPV. That condition holds even under aggressive compression of the synergy estimates.
Objection 5: Tau Silencing May Not Translate to Cognitive Benefit
The long-horizon platform value developed in Section XII and the synergy estimates in Section X ultimately depend on ARO-MAPT reaching commercial approval for Alzheimer’s disease. That requires tau silencing to translate to cognitive benefit in a Phase 2 or Phase 3 cognitive endpoint trial. BIIB080’s CELIA Phase 2 data is expected to read out in 2026, potentially before the ARO-MAPT Phase 1 readout, and will partially but not fully resolve the cognitive translation question. If tau silencing does not produce the cognitive benefit required for approval, if biomarker success does not translate to endpoint success, the long-term AD franchise value compresses substantially, and the acquisition rationale that depends on that franchise weakens.
The objection identifies the single largest residual uncertainty in the long-term thesis. Even a successful Phase 1 biomarker readout does not resolve the cognitive translation question; it resolves delivery and biomarker pharmacology only. But the thesis this paper develops does not require cognitive translation to be resolved at Stage 1. The Stage 1 acquisition occurs under uncertainty about cognitive endpoints, that is precisely why the probability of ultimate AD approval in Section VI’s Monte Carlo is 20 to 25 percent at Stage 1 rather than the 50 to 60 percent it would reach after positive Phase 2 cognitive data. The $55 to $90 billion Stage 1 range already incorporates cognitive translation risk through the probability-adjusted rNPV inputs. An acquirer paying in this range is not betting that cognitive translation succeeds; they are buying probability-weighted exposure across the full outcome distribution, with the strategic premium over standalone rNPV compensating for the defensive value and platform optionality that are real independent of the cognitive translation question.
Tau silencing as a mechanism has substantial independent support: MAPT mutations cause familial tauopathies directly, tau accumulation correlates tightly with cognitive decline across all Alzheimer’s stages, and BIIB080 has established that tau can be safely silenced in humans at meaningful magnitude. What remains unresolved is not whether tau is a legitimate therapeutic target, but whether the magnitude and durability of silencing ARO-MAPT achieves translates to clinical benefit within the trial design and patient population chosen. That is a real risk, but it is the same risk every tau-silencing asset faces, and it is appropriately priced into the probability inputs used in the paper’s valuation methodologies. The CELIA readout adds a sequence risk worth flagging: a positive CELIA result before the ARO-MAPT Phase 1 readout would partially de-risk the cognitive translation question and raise the probability inputs across the paper’s methodologies, while a negative result would compress them in the opposite direction.
What the Thesis Requires and What It Does Not
The five objections above are the strongest counter-arguments a sophisticated skeptic would raise. None of them is fatal to the thesis. Each one compresses a specific input, the base-rate magnitude of the acquisition range and its comparable-transaction anchors, the probability the auction develops, the magnitude of acquirer-specific synergy, the timeline for acquisition, and the long-term cognitive translation probability, but none of them eliminates the central analytical observation: that Arrowhead at today’s $9.8 billion market cap is priced as if the weak Phase 1 scenario were the probability-weighted base case, which is inconsistent with the prior evidence base developed in Sections I and II.
The conditions the thesis requires map directly to the objections above. First, against Objection 1, the structural conditions that place Arrowhead in the tail of the base-rate distribution, unique subcutaneous CNS delivery, three motivated bidders, two-franchise Lilly fit, must hold at Stage 1. Second, against Objection 2, at least one strategic acquirer must engage at Stage 1 rather than waiting for Phase 2 cognitive data. Third, against Objection 3, competitive pressure must develop, at minimum a two-bidder auction where Roche participates, setting a clearing price above single-bidder negotiation outcomes. Fourth, against Objection 4, bidder-specific synergy must survive reasonable compression, the minimum-motivated-bidder synergy (Roche’s) must remain large enough to produce a walk-away meaningfully above standalone rNPV. Fifth, against Objection 5, the cognitive translation probability priced into the Section VI Monte Carlo (20 to 25 percent at Stage 1) must remain defensible, with CELIA providing partial resolution. None of these conditions is certain, but all are more likely than not under the prior evidence base developed across Sections I through XII.
The thesis does not require every element of Sections V through XII to materialize at the upper end of its range. It requires the middle of the range to be realistic and the lower end of the range to be protective. Both conditions hold under the analytical framework developed across this paper. That is the sense in which the thesis is robust to reasonable objection: not that it is immune to compression, but that the compressed outcome still produces a meaningful positive return from today’s entry point, and the uncompressed outcome produces a transformative return.
Five sophisticated objections each compress a specific input. None is fatal. The thesis is robust to reasonable objection: the compressed outcome still produces a meaningful positive return from today’s entry, and the uncompressed outcome produces a transformative return.
XIV. Conclusion
This paper answers one question: is today a better entry point for Arrowhead than the moment after the Phase 1 data arrives? The answer is yes. Today’s entry is asymmetric, the potential upside is much larger than the downside, in a way that won’t be true once the data is public. The asymmetry is large enough to justify a position despite the risks Section XIII catalogs.
If ARO-MAPT Phase 1 produces strong data in 2H2026, the probable outcome is an acquisition in the $55 to $90 billion range. That is 5.1 to 8.3 times today’s $70 share price, or $355 to $581 per share for investors holding through the transaction. Four separate valuation methods, each one grounded in how pharmaceutical M&A teams actually price deals, converge on this range. It is not one model’s forecast; it is where multiple independent frameworks arrive at the same answer. If no deal closes in the 12 to 18 months after positive Phase 1 data, a second acquisition window opens in the $110 to $150 billion range if Phase 2 cognitive data is positive in 2029 or 2030. That is forward upside for investors who stay in the position past Stage 1.
Today is the better entry point because the Phase 1 outcome is still unknown. An investor buying today is buying a claim on all three possible outcomes, strong, moderate, and weak, at a single price. An investor waiting for the readout is buying only the outcome that actually happens, at a price that has already moved to reflect it. The existing evidence, BIIB080’s tau-silencing data in humans, trontinemab’s validation of crossing the blood-brain-barrier with a similar delivery mechanism, and Arrowhead’s strong non-human-primate data, makes the weak scenario meaningfully less likely than today’s $9.8 billion market cap implies. Put simply: the market is priced as if the worst case is the likely outcome. The evidence says the worst case is not the likely outcome. The gap will close either when the Phase 1 data arrives or when other institutional investors recognize the mismatch first.
Here is what the investment case looks like scenario by scenario. If Phase 1 data is strong (estimated probability 40 to 50 percent), an investor holding the position earns 5 to 9 times their investment, either through an acquisition within 6 to 18 months of the readout or through a sharp re-rating in the public market with the second acquisition window as additional upside. If the data is moderate (estimated probability 30 to 35 percent), the stock re-rates 1.5 to 2.6 times, and an ARO-MAPT licensing deal adds $8 to $24 billion in probability-weighted value to shareholders, with a positive Phase 2 cognitive readout as a further path to upside. If the data is weak (estimated probability 20 to 25 percent), the return is approximately flat to mildly negative; the non-CNS commercial business (plozasiran for severe hypertriglyceridemia, the pre-commercial obesity program, the partnered Sarepta and Novartis assets) provides a floor near today’s market cap. The weighted average of these outcomes is clearly positive, and the large upside scenarios are not available at any price once the data is public.
The Phase 1 data readout expected in the second half of 2026 will resolve the central question this paper has analyzed. If ARO-MAPT delivers human confirmation of subcutaneous CNS delivery and measurable CSF tau reduction, the acquisition scenario described here moves from conditional to probable. The question will no longer be whether the platform works, it will be which company sits across the table from Christopher Anzalone, and how much they are willing to pay to not let the other bidder win.
Glossary
The following terms, abbreviations, and named products appear in the paper. Definitions are written for readers who may not share the author’s familiarity with biotech investing, pharmaceutical development, or M&A analysis. Entries are alphabetical.
AD
Alzheimer’s Disease. The most common form of dementia, affecting over seven million Americans. The primary target indication for ARO-MAPT.
Alnylam
Alnylam Pharmaceuticals. A competitor developing RNAi therapeutics, with a CNS program delivered intrathecally (via lumbar puncture). Contrasts with Arrowhead’s subcutaneous TRiM-BBB delivery.
ARIA
Amyloid-Related Imaging Abnormalities. Brain swelling or bleeding observed as a side effect of anti-amyloid therapies like Leqembi and Kisunla, requiring MRI monitoring. ARO-MAPT targets tau rather than amyloid and does not carry ARIA risk.
ARO-ALK7
Arrowhead’s preclinical RNAi therapeutic targeting ALK7 for obesity. Addresses adipocyte-level signaling, complementary to ARO-INHBE.
ARO-ATXN1, ARO-ATXN2, ARO-ATXN3
Arrowhead’s investigational RNAi therapeutics targeting ataxin genes for rare neurological diseases (SCA1, SCA2, SCA3). Licensed to Sarepta Therapeutics.
ARO-C3
Arrowhead’s investigational RNAi therapeutic targeting complement component 3 for IgA nephropathy and other complement-mediated diseases. Phase 1/2.
ARO-DIMER-PA
Arrowhead’s preclinical dual RNAi therapeutic silencing both PCSK9 and APOC3 in a single molecule. Delivers combined LDL-cholesterol and triglyceride reduction.
ARO-DM1
Arrowhead’s investigational RNAi therapeutic targeting the DMPK gene for myotonic dystrophy type 1. Licensed to Sarepta Therapeutics.
ARO-HTT
Arrowhead’s investigational RNAi therapeutic targeting huntingtin for Huntington’s disease. Licensed to Sarepta Therapeutics.
ARO-INHBE
Arrowhead’s investigational RNAi therapeutic targeting Activin E for obesity. January 2026 Phase 1/2a data showed doubled weight loss and tripled fat reduction when combined with tirzepatide.
ARO-MAPT
Arrowhead’s investigational RNAi therapeutic targeting the MAPT gene. Designed to silence tau production via subcutaneous injection crossing the blood-brain barrier. The central asset of this paper’s thesis. Phase 1 readout expected 2H 2026.
ARO-MMP7 (SRP-1002)
Arrowhead’s investigational RNAi therapeutic targeting matrix metalloproteinase 7 for idiopathic pulmonary fibrosis. Licensed to Sarepta Therapeutics.
ARO-RAGE
Arrowhead’s investigational RNAi therapeutic targeting the RAGE receptor for pulmonary inflammatory disease. Phase 1/2 achieved 90 to 95 percent gene knockdown via inhalation.
ARO-SNCA
Arrowhead’s preclinical RNAi therapeutic targeting alpha-synuclein for Parkinson’s disease. Licensed to Novartis in October 2025 for $200M upfront, $2B in milestones, plus royalties. The deal is the template for a potential ARO-MAPT licensing transaction.
Avidity Biosciences
Biotech company acquired by Novartis in October 2025 for approximately $12 billion, which absorbed a portion of Novartis’s 2026 neuroscience M&A capital.
BBB
Blood-Brain Barrier. The highly selective cellular barrier separating blood from brain tissue and the defining challenge of CNS drug delivery. ARO-MAPT crosses the BBB via TfR1-mediated transcytosis after subcutaneous injection.
Biomarker
A measurable biological indicator of disease activity or drug effect. CSF tau reduction is the primary biomarker for ARO-MAPT Phase 1.
Biogen
Major biotechnology company. Developer of BIIB080 (tau ASO) and partner of Ionis Pharmaceuticals on multiple CNS programs.
BIIB080
Ionis/Biogen’s intrathecal antisense oligonucleotide targeting MAPT. The first tau-silencing therapy in human trials. Phase 1b demonstrated 51 to 56 percent CSF tau reduction. Establishes the human proof-of-mechanism that ARO-MAPT builds on with a superior delivery route.
CAPITAN
Phase 3 cardiovascular outcomes trial of plozasiran in patients with mixed hyperlipidemia and residual cardiovascular risk. Potential readout approximately 2029.
CBD
Corticobasal Degeneration. A rare, fatal tauopathy with no approved disease-modifying therapy. An orphan indication in the ARO-MAPT indication ladder.
CELIA
Biogen’s Phase 2 clinical trial of BIIB080 in early Alzheimer’s disease. Expected to read out in 2026, potentially before the ARO-MAPT Phase 1 readout. A positive CELIA result would provide additional human validation that tau reduction slows cognitive decline.
CNS
Central Nervous System. The brain and spinal cord. The most challenging target for drug delivery because of the blood-brain barrier.
Comparable transactions
A valuation methodology that anchors on pre-data acquisition multiples paid in structurally similar prior deals. The paper anchors on Prometheus, MyoKardia, Karuna, and ImmunoGen as the closest comparables to an Arrowhead Stage 1 acquisition.
CSF
Cerebrospinal Fluid. The fluid surrounding the brain and spinal cord. CSF tau reduction is the primary pharmacodynamic endpoint for ARO-MAPT Phase 1.
CVOT
Cardiovascular Outcomes Trial. A large randomized trial designed to demonstrate that a drug reduces major cardiovascular events. Required for broad cardiovascular labeling. CAPITAN is Arrowhead’s CVOT for plozasiran.
Elecsys
Roche’s branded in vitro diagnostic platform. Includes AD diagnostic assays. A component of Roche’s strategic synergy in the Stage 1 acquisition thesis.
FCS
Familial Chylomicronemia Syndrome. An ultra-rare genetic disorder causing severely elevated triglycerides and risk of life-threatening pancreatitis. Plozasiran (Redemplo) received FDA approval for FCS in November 2025.
FDA
US Food and Drug Administration. The US federal agency responsible for approving drugs and biological products.
Fully diluted shares
The total number of shares outstanding after all stock options, warrants, convertible securities, and similar instruments are counted as if exercised. The acquisition per-share calculations in this paper use approximately 155 million fully diluted shares.
Gene X
Arrowhead’s undisclosed target referenced in a December 10, 2025 CNS Delivery Summit presentation showing approximately 90 percent non-human-primate brain knockdown for a cardiometabolic indication. Section XII uses Gene X as evidence that Arrowhead’s platform engine produces programs the sell-side cannot model.
Genentech
Biotechnology company acquired by Roche in 2009 for $46.8 billion. At the time analysts characterized the price as expensive. The platform subsequently generated hundreds of billions of dollars of cumulative revenue under Roche ownership. Referenced in the paper as the closest historical precedent for a platform acquisition at the scale the Stage 1 thesis contemplates.
GLP-1
Glucagon-Like Peptide-1 agonists. A class of injectable therapies for obesity and diabetes including semaglutide (Ozempic, Wegovy) and tirzepatide (Mounjaro, Zepbound). GLP-1 adoption via auto-injector pens has normalized subcutaneous injection as a drug delivery format.
GMP
Good Manufacturing Practice. FDA-regulated standards for pharmaceutical manufacturing. Arrowhead’s Verona facility is GMP-compliant.
HCM
Hypertrophic Cardiomyopathy. A genetic heart muscle disease. The primary indication for mavacamten, the asset that drove BMS’s 2020 acquisition of MyoKardia (a paper comparable).
ImmunoGen
Comparable pre-data transaction: AbbVie’s 2023 acquisition at approximately 12.6× pre-data market cap. One of the four comparables anchoring the paper’s pre-data multiple range.
Intrathecal
A drug delivery route directly into the cerebrospinal fluid via lumbar puncture. Used by BIIB080 and by Alnylam’s CNS pipeline. Clinically significant barrier to patient uptake. Contrasts with ARO-MAPT’s subcutaneous delivery.
Ionis
Ionis Pharmaceuticals. Developer of antisense oligonucleotide therapeutics. Partner with Biogen on BIIB080 and other CNS programs.
Karuna
Comparable pre-data transaction: BMS’s 2023 acquisition at approximately 9.3× pre-data market cap. One of the four comparables anchoring the paper’s pre-data multiple range.
Kisunla
Eli Lilly’s approved anti-amyloid antibody (donanemab) for early Alzheimer’s disease. Positioned around finite therapy (patients stop dosing after amyloid clearance). A competitor-owned ARO-MAPT would threaten Kisunla’s positioning through mechanism adjacency, which produces much of the defensive synergy value in Lilly’s Stage 1 bid capacity.
Knockdown
The reduction in target gene expression (mRNA or protein) produced by an RNAi or antisense therapeutic. ARO-MAPT Phase 1 will report CSF tau knockdown as its primary pharmacodynamic readout.
Leqembi
Eisai/Biogen’s approved anti-amyloid antibody (lecanemab) for early Alzheimer’s disease. Competes directly with Kisunla. Carries ARIA risk and requires MRI monitoring.
LY-3954068
Eli Lilly’s own intrathecal tau siRNA program in Phase 1 for Alzheimer’s disease. Its existence confirms Lilly’s internal conviction that tau silencing is a valid mechanism, which raises Lilly’s internal probability estimate for ARO-MAPT and contributes to Lilly’s defensive rationale for acquiring the subcutaneous alternative.
M&A
Mergers and Acquisitions. The field encompassing the buying, selling, and combining of companies.
MAPT
Microtubule-Associated Protein Tau. The gene encoding the tau protein. Pathological tau accumulation is a hallmark of Alzheimer’s disease and other tauopathies. ARO-MAPT silences this gene.
Monte Carlo simulation
A probabilistic valuation methodology that runs thousands of iterations across probability-weighted input distributions (efficacy, probability of success, commercial adoption, pricing) to produce an output distribution of enterprise values rather than a single point estimate. Section VI develops Arrowhead’s Monte Carlo output.
MyoKardia
Comparable pre-data transaction: BMS’s 2020 acquisition for mavacamten at approximately 6.5× pre-data market cap. One of the four comparables anchoring the paper’s pre-data multiple range.
Non-human primate
Cynomolgus macaques used in ARO-MAPT preclinical studies. TRiM-BBB delivery produced 70 to 80 percent mRNA knockdown and 50 to 60 percent CSF tau reduction. TfR1 binding is confirmed identical between non-human primate and human.
Peak revenue multiple
A valuation methodology that applies historical pharmaceutical M&A multiples (typically 4 to 6 times) to risk-adjusted peak revenue forecasts for a target asset. One of the four valuation methodologies developed in Section V.
Phase 1 / Phase 2 / Phase 3
The three stages of clinical development prior to regulatory submission. Phase 1 tests safety and pharmacology in small numbers of subjects (typically 20 to 80). Phase 2 tests efficacy in patients (100 to 500). Phase 3 confirms efficacy in large randomized trials (often 500 to 5,000+). ARO-MAPT is in Phase 1; readout expected 2H 2026.
Plozasiran
Arrowhead’s approved RNAi therapeutic targeting APOC3 for severe hypertriglyceridemia. Brand name Redemplo. FDA approved for FCS in November 2025. Supplemental NDA for broader sHTG anticipated 2026.
Prometheus
Comparable pre-data transaction: Merck’s 2023 acquisition at approximately 10.8× pre-data market cap. One of the four comparables anchoring the paper’s pre-data multiple range.
PSP
Progressive Supranuclear Palsy. A fatal tauopathy affecting 20,000 to 30,000 US patients with no approved disease-modifying therapy. An orphan indication in the ARO-MAPT indication ladder.
Redemplo
Brand name of Arrowhead’s plozasiran, the first commercially approved RNAi therapeutic in Arrowhead’s cardiometabolic franchise.
Re-rate / re-rating
A repricing of a stock by the market following a catalyst (such as clinical data or regulatory decision). The Phase 1 readout is expected to produce a material re-rate of Arrowhead across all three scenarios.
RNAi
RNA Interference. A natural cellular mechanism that silences gene expression by degrading messenger RNA before protein is produced. The foundational mechanism used by all Arrowhead therapeutics.
rNPV
Risk-Adjusted Net Present Value. A standard pharmaceutical valuation methodology that projects probability-weighted future cash flows and discounts them to present value. Used by sell-side analysts. The paper argues this framework systematically undervalues platform companies at delivery inflection points, including Arrowhead today.
Sarepta
Sarepta Therapeutics. Licensing agreement announced November 2024 and closed February 2025 ($325M equity at 35 percent premium plus milestones and royalties), covering a portfolio of Arrowhead programs including ARO-HTT, ARO-ATXN1, ARO-ATXN2, ARO-ATXN3, ARO-MMP7 (SRP-1002), ARO-DM1, and ARO-DUX4.
sHTG
Severe Hypertriglyceridemia. Triglyceride levels at or above 500 mg/dL, affecting three to four million US patients. Plozasiran’s Phase 3 supplemental indication following FCS approval.
siRNA
Small Interfering RNA. The active RNA molecule in RNAi therapeutics that guides the cellular silencing machinery to its target mRNA. The effector component of ARO-MAPT and other Arrowhead programs.
Stage 1 / Stage 2
Paper-specific terminology for two distinct acquisition windows. Stage 1 is the window that follows strong Phase 1 data in 2H 2026, estimated at $55 to $90 billion. Stage 2 is the subsequent window that opens if no transaction clears within 12 to 18 months and positive Phase 2 cognitive endpoint data reads out in 2029 to 2030, estimated at $110 to $150 billion.
Subcutaneous
A drug delivery route via injection into the tissue layer beneath the skin, typically with a short needle similar to insulin or GLP-1 auto-injector devices. Distinguishes ARO-MAPT from intrathecal CNS therapeutics like BIIB080 that require lumbar puncture.
SVA
Strategic Value Analysis. The acquirer-specific valuation framework described in Section II, incorporating synergies, defensive value, competitive positioning, and platform optionality. Contrasts with rNPV, which does not incorporate these components.
Synergy
The incremental value an acquirer captures from combining a target with its existing operations. Includes revenue synergies (combination-product pricing, shared sales force), cost synergies (infrastructure integration), and defensive synergies (preventing a competitor from owning the asset). Section V develops bidder-specific synergy ranges for Lilly, Roche, and Novartis.
Tau / tauopathy
Tau is a microtubule-stabilizing protein in neurons. Abnormal tau accumulation is a hallmark of Alzheimer’s disease and other neurodegenerative diseases collectively called tauopathies, which include PSP, CBD, and FTD-MAPT.
TfR1
Transferrin Receptor 1. The protein that transports iron across the blood-brain barrier. ARO-MAPT is engineered to bind TfR1, enabling subcutaneous-to-CNS delivery via transcytosis. TfR1 binding architecture is confirmed identical between non-human primate and human.
Tirzepatide
Eli Lilly’s GLP-1/GIP dual agonist for obesity and diabetes. Brand names Mounjaro and Zepbound. Combination with ARO-INHBE showed doubled weight loss and tripled fat reduction versus tirzepatide alone in January 2026 Phase 1/2a data.
Transcytosis
The biological process of transporting a substance across a cell from one surface to the other. TfR1-mediated transcytosis is how ARO-MAPT crosses the blood-brain barrier after subcutaneous injection.
TRiM
Targeted RNAi Molecule. Arrowhead’s proprietary platform technology that conjugates a targeting ligand to a siRNA trigger, enabling delivery to specific cell types. Validated across liver, lung, adipose, muscle, tumor/kidney, and CNS (via BBB crossing) tissues in clinical or preclinical settings.
Trontinemab
Roche’s Phase 3 anti-amyloid antibody for early Alzheimer’s disease. Uses TfR1-mediated blood-brain-barrier transcytosis as its delivery mechanism, which is the same delivery mechanism class ARO-MAPT uses. Trontinemab’s clinical validation of TfR1-mediated BBB crossing in humans is one of the three pillars of prior evidence supporting ARO-MAPT.
Tryngolza
Ionis Pharmaceuticals’ olezarsen. An antisense oligonucleotide approved for FCS that competes with Redemplo (plozasiran). Examined in detail in the second BioBoyScout paper.
Verona
Arrowhead’s GMP manufacturing facility in Verona, Wisconsin. Three operational production lines for TRiM therapeutics, plus an option through 2028 on 6.24 adjacent acres for expansion. Section XII develops Verona as approximately $3 to $6 billion of strategic currency to an acquirer.
Walk-away price
In M&A, the maximum price a bidder is willing to pay while the acquisition remains value-accretive. Calculated as standalone rNPV plus the bidder’s share of acquirer-specific synergy. Section X develops walk-away prices for Lilly ($73 to $124 billion), Roche ($58 to $85 billion), and Novartis ($47 to $64 billion).
A Note on Supporting Independent Research
These white papers took hundreds of hours to produce. The asset inventory, valuation methodology, bidder analysis, comparable transaction work, acquisition thesis, competitor analysis, supporting charts, and science analytics are the result of deep primary research and is not available in sell-side coverage. Most of the analysis presented represents independent research not published elsewhere. It is being shared freely because the thesis deserves the widest possible audience. If ARO-MAPT delivers in 2H 2026, every Arrowhead shareholder benefits from a well-informed market that understands what the data means and what the asset is worth. That is why this paper exists.
If this research has been valuable to you, whether it shaped your thinking, validated your conviction, or simply saved you the time of doing this work yourself, a voluntary contribution is genuinely appreciated and directly funds the next paper.
For individual investors and readers
Any amount you feel reflects the value you received is welcome and meaningful. A contribution in the range of what you might pay for a single premium research report is a thoughtful gesture that makes a real difference.
For family offices, investment funds, hedge funds, and research platforms
This paper is the caliber of work that institutional research desks bill significant retainers to produce. If your team referenced it, distributed it internally, or used it to inform a position, a suggested contribution of $1,500 or more reflects the professional value of the analysis, though any amount is meaningful. Your support makes it possible to continue publishing at this level without a paywall that limits the reach of the ideas. If your organization requires an invoice to process a payment, please reach out directly at bioboyscout@gmail.com and one will be provided promptly.
There is no obligation and no expectation. This is purely a thank you for work that meant something to you.
Zelle: (847) 227-7909
Thank you for reading, and for being part of a community that takes this thesis seriously.
— Robert Toczycki | BioBoyScout
A Personal Note
When I started this paper, I expected to build a bull case, not to find one that kept getting stronger the deeper I went. My initial framing was a simple conditional: if ARO-MAPT works, what is Arrowhead worth to a strategic acquirer? I assumed the math would produce a large number that I would then need to stress-test and defend.
What I did not expect was for four independent valuation methodologies to converge on the same range without being forced to. I did not expect the comparable transaction analysis to anchor near the bottom-up rNPV result. I did not expect the Monte Carlo distribution to produce a median that sits above the acquisition target, with even the 10th percentile scenario still representing a multiple of today’s market cap.
Each time I revisited the probability assumptions, the thesis survived. Each time I rebuilt the valuation from a different direction, the numbers converged in the same place. That convergence, across methods and across probability scenarios, is what ultimately convinced me that the analysis is valid. Not that ARO-MAPT will succeed, I cannot know that, and the paper does not claim it. If it does, the numbers are real, the strategic logic is sound, and the gap between the current price and what this company is worth to the right acquirer is as large as the math says it is.
I hold a long position in ARWR. I held one before I started this paper. The research did not create the conviction, but it deepened it considerably.
— Robert Toczycki | BioBoyScout
Important Risks, Disclosures, & Disclaimers
The author, Robert Toczycki (aka BioBoyScout), certifies that:
all views expressed in this white paper accurately reflect his personal opinions about the topic discussed; and
he was not compensated in any form for producing this white paper.
This white paper is published by BioBoyScout and is intended for informational and educational purposes only. It does not constitute investment advice, a solicitation to buy or sell securities, or a guarantee of future results. The author holds a long position in Arrowhead common stock. Arrowhead Pharmaceuticals (ARWR) is a publicly traded company; investments in its shares involve material risks, including the risk of total loss. All financial projections, acquisition price estimates, and valuation analyses herein are hypothetical frameworks for analytical purposes and do not represent predictions of actual outcomes. Readers should conduct their own due diligence and consult a registered investment advisor before making investment decisions. All data cited herein were sourced from publicly available company disclosures, SEC filings, press releases, and peer-reviewed literature as of April 2026.
About the Author
Robert Toczycki is an independent analyst and registered US Patent Attorney with a JD, an Executive MBA completed at the top of his class, and a BS in Mathematics and Computer Science from the University of Illinois at Urbana-Champaign. He has a deep passion for financial analysis, particularly identifying valuation discrepancies and demonstrating them through rigorous, data-driven research and solid analytics.
Comments or questions: bioboyscout@gmail.com.
Copyright © 2026, BioBoyScout. All Rights Reserved.